一、题意描述
Loan Predict 题目链接
Loan Predict Problem讲述了一个根据贷款申请者提供的一些个人信息,来预测是否能通过贷款申请的问题。题目提供了trian、test数据及需提交结果的数据格式。
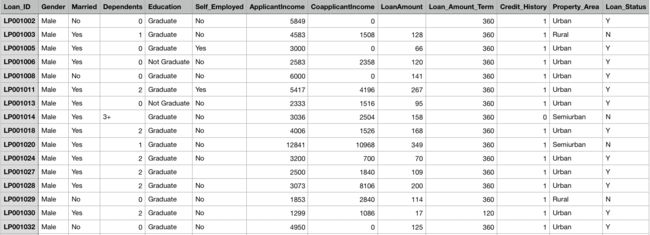
部分train和test数据

数据格式
二、数据分析
先提出数据对结果影响的假设,运用python numpy、seaborn、pandas等模块可视化数据,确定关系。
- Salary: Applicants with high income should have more chances of loan approval.
- Previous history: Applicants who have repayed their previous debts should have higher chances of loan approval.
- Loan amount: Loan approval should also depend on the loan amount. If the loan amount is less, chances of loan approval should be high.
- Loan term: Loan for less time period and less amount should have higher chances of approval.
- EMI: Lesser the amount to be paid monthly to repay the loan, higher the chances of loan approval.
数据分析主要包括单变量、二变量、缺失值填充和异常值纠正等。
1、Univariate Analysis
对离散型变量
plt.figure(1)
plt.subplot(131)
train['Dependents'].value_counts(normalize=True).plot.bar(figsize=(24,6),title='Dependents')
plt.subplot(132)
train['Education'].value_counts(normalize=True).plot.bar(title='Education')
plt.subplot(133)
train['Property_Area'].value_counts(normalize=True).plot.bar(title='Property_Area')
plt.show()
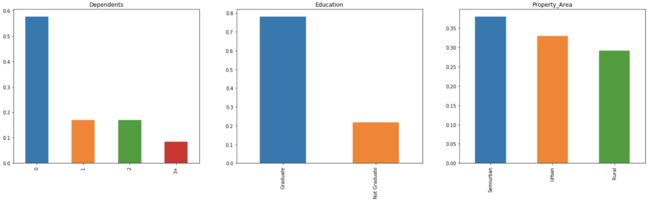
Categorical Vs Analysis
对连续型变量
plt.figure(1)
plt.subplot(141)
df=train.dropna()
sns.distplot(df['LoanAmount']);
plt.subplot(142)
train['LoanAmount'].plot.box(figsize=(16, 5))

Continous Vs Analysis
2、Bivariate Analysis
train['Total_Income']=train['ApplicantIncome']+train['CoapplicantIncome']
bins=[0, 2500,4000,6000,81000]
group=['low','average','high','very high']
train['Total_Income_bin']=pd.cut(train['Total_Income'],bins,labels=group)
Total_Income_bin=pd.crosstab(train['Total_Income_bin'],train['Loan_Status'])
Total_Income_bin.div(Total_Income_bin.sum(1).astype(float),axis=0).plot(kind='bar',stacked=True)
plt.xlabel('TotalIncome')
plt.ylabel('Persentage')
上面的例子分析了applicant和coapplicant的收入情况是否对申请有影响。
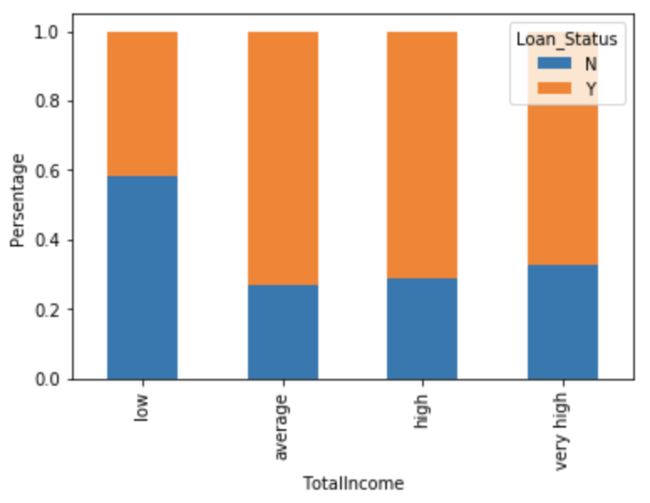
TotalIncome与Loan_Status关系
能从图中看出总收入低对申请贷款有不利影响。
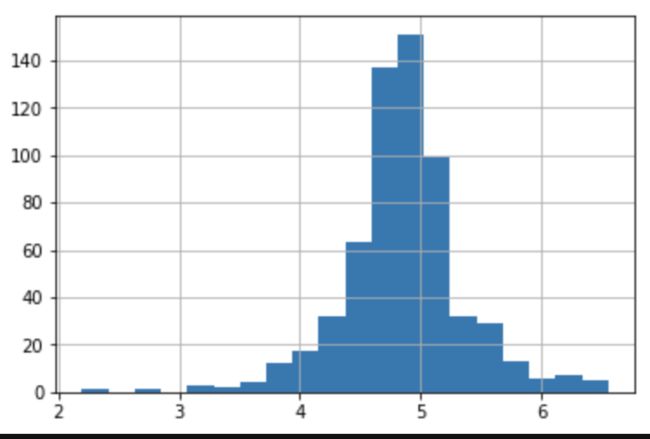
3、Missing Value and Outlier Treatment
Missing Value
train.isnull().sum() #查看各列缺失值个数
根据情况采用如下补全缺失值方式
- For numerical variables: imputation using mean or median
- For categorical variables: imputation using mode
例如:
train['Credit_History'].fillna(train['Credit_History'].mode()[0], inplace=True)
train['LoanAmount'].fillna(train['LoanAmount'].median(), inplace=True)
Outlier
一般这样的值对整个样本的平均值和标准差影响巨大
train['LoanAmount_log'] = np.log(train['LoanAmount'])
train['LoanAmount_log'].hist(bins=20)
test['LoanAmount_log'] = np.log(test['LoanAmount'])
Outlier Treatment
三、模型建立
首先需要把train和test数据集里无关的数据删掉,比如Loan_ID字段。然后将剩下的feature作为X向量,y作为分类结果。
X = train.drop('Loan_Status',1)
y = train.Loan_Status
X=pd.get_dummies(X)
train=pd.get_dummies(train)
test=pd.get_dummies(test)
这次练习用到了cross validation,即从train数据中分出30%作为交叉验证的数据集。
from sklearn.model_selection import train_test_split
x_train, x_cv, y_train, y_cv = train_test_split(X,y, test_size =0.3)
from sklearn.linear_model import LogisticRegression
from sklearn.metrics import accuracy_score
model = LogisticRegression()
model.fit(x_train, y_train)
整个模型就建立起来了,用它来做预测,最后得到的准确率有81%左右。
pred_cv = model.predict(x_cv)
accuracy_score(y_cv,pred_cv)
对一个二分类问题来说,这样的准确率肯定是不够的,所以还应该从特征分析,算法选择等多种思路上进行优化。