1. Stop when exception
1.1 Open Breakpoint navigator (Cmd + 8)
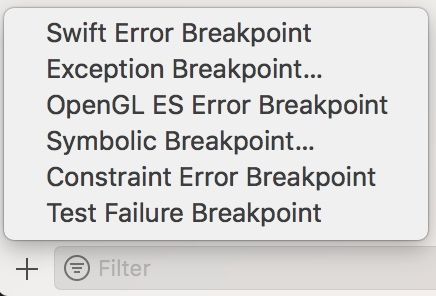
1.2 Add Exception Breakpoint
1.3 Keep default values
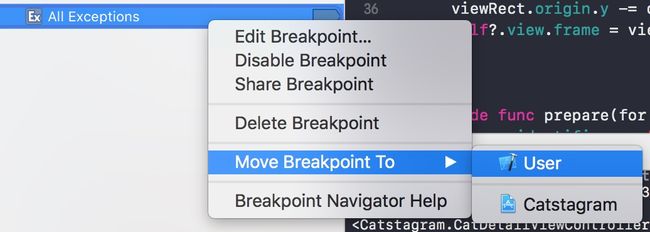
1.4 Move breakpoint to User level
2. Edit breakpoint
-
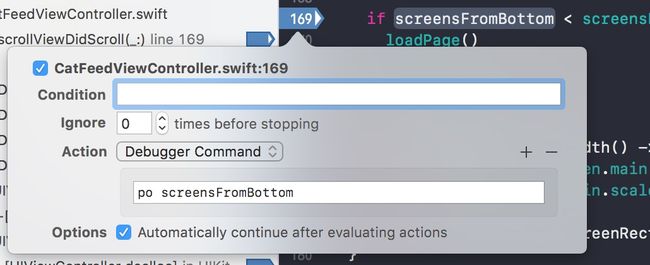
Edit Breakpoint
- Add
Debugger Command:
We will see the following output:
7.89903245455977
7.890427382096
7.87502883137136
7.87004694731339
- or Add
Log Message
ScreensFromBottom: @screensFromBottom@ Threshold: @screensFromBottomToLoadMoreCats@
We will see the logs in output window:
ScreensFromBottom: 8.5084718344868104 Threshold: 2.5
ScreensFromBottom: 8.5034899504288379 Threshold: 2.5
ScreensFromBottom: 8.499866762023041 Threshold: 2.5
ScreensFromBottom: 8.4966964721679688 Threshold: 2.5
ScreensFromBottom: 8.4948848779650703 Threshold: 2.5
ScreensFromBottom: 8.4921674866607226 Threshold: 2.5
ScreensFromBottom: 8.4899029939070996 Threshold: 2.5
ScreensFromBottom: 8.4880913997042011 Threshold: 2.5
3. Symbolic breakpoint - Condition
For example, check if some specified UIViewController is released properly.
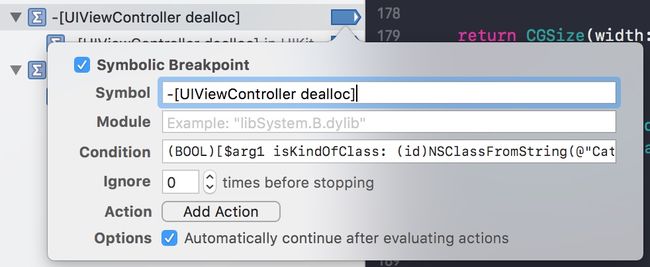
- Add
Symbolic Breakpoint...
- (Optional)
Add Condition:
Check if it is UIViewController:
(BOOL)[$arg1 isKindOfClass: isKindOfClass: [UIViewController class]]
Check if it is user's custom CatDetailViewController:
(BOOL)[$arg1 isKindOfClass: (id)NSClassFromString(@"Catstagram.CatDetailViewController")]
3. Symbolic breakpoint - Action
Print the class name when UIView released:
We will see the following output:
<_UIVisualEffectSubview: 0x7f9e6e41aea0; frame = (0 0; 414 64); autoresize = W+H; userInteractionEnabled = NO; layer = >
>
>
>
>
>
>
4. LLDB
LLDB is Apple’s “from the ground up” replacement for GDB, developed in close coordination with the LLVM compilers to bring you state-of-the-art debugging with extensive capabilities in flow control and data inspection. Starting with Xcode 5, all new and preexisting development projects are automatically reconfigured to use LLDB.
reference: http://lldb.llvm.org/lldb-gdb.html
4.1 p/po
4.2 frame variable(fr v)
frame variable is only for printing the contents of variables, no side effect to variable
(lldb) frame var global
(int32_t) global = 5
example:
(lldb) p screensFromBottom
(CGFloat) $R1 = 9.3780370518781133
(lldb) po screensFromBottom
9.37803705187811

(lldb) frame variable screensFromBottom
(CGFloat) screensFromBottom = 9.3780370518781133
(lldb) fr v screensFromBottom
(CGFloat) screensFromBottom = 9.3780370518781133
(lldb)
4.3 Variable out of scope
Create a variable out of debug session scope by using $:
(lldb) p let $label = cell.titleLabel
(lldb) p print($label.text!)
5. Changing UI when debugging
run CATransaction.flush(), flush pending changing to the UI:
(lldb) p titleLabel.text = "Hello lldb"
(lldb) p CATransaction.flush()
6. Get memory address of return value of a function:
(lldb) register read $rax
rax = 0x000062401232eb99a
Print out the memory in LLDB:
(lldb) po unsafeBitCast(0x000062401232eb99a, to UIImage.self)
, {40, 40}

(lldb)


