一个空的模板页,有类似html的title detail等元素
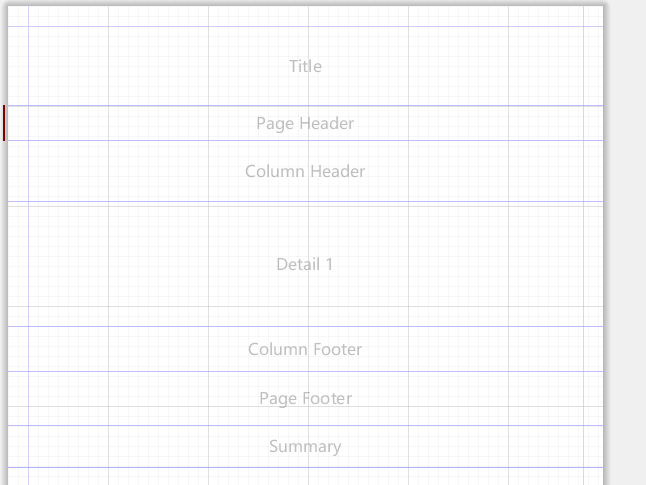
本节主要讲解模板设计中如何放置模板元素达到我们想要的效果,涉及到模板元素的使用,如detail,column header等,下面将一一讲解outline中各个自带元素的使用

Tille
标题 Title在第一页中显示,而第二页和第三页都不会再显示,所以Title只会显示一次。
Detail
则是要放置填充数据的位置,因为它会加载多次,有多少条数据就会加载多少次,保证了数据可以全部显示出来。
Page Header
顾名思义,页的头部,应该就是我们所说的页眉,我们的word文档一般都会有页眉, Page Header会在每一页都加载一次,与Detail作用一致
Column Header & Column Footer
首先看名字,表头与表尾,作用与Page Header应该相差无几,都是提示文字,表头可以放表格里列的名字,表尾可以放一些数据的总结概括等等。
在Column Header 和 Column Footer各自放置两段Static Text,然后进行预览。

Page Footer
有了页眉,自然有对应的页脚。一般页脚的作用都是用于显示页数的
Last Page Footer
Page Footer是没法显示最后一页的。幸好还有一个元素,Last Page Footer,这个元素就是用以最后一页页脚的
Summary
Summary是数据显示完之后用以总结的,并且会出现在Detail表格下方
No Data
不知道是干什么的
Background
Background应该是报表的背景
官方文档说明
TITLE
This is the first section of the report. It is generated only once during the report-filling
process and represents the beginning of the resulting document.
The title section precedes even the page header section. To print the page header before
the title section, put the elements on the page header at the beginning of the title section
as well. You can suppress the actual page header on the first page using the
《printWhenExpression》, based on the PAGE_NUMBER report variable.
As described in “Report Template Properties” on page 42, the title section can be
followed by a page break if the isTitleNewPage attribute is set to true.
PAGE HEADER
This section appears at the top of each page in the generated document.
COLUMN HEADER
This section appears at the top of each column in the generated document.
DETAIL
For each record in the data source, the engine tries to generate this section. The detail
section can be made of multiple bands.
COLUMN FOOTER
This section appears at the bottom of each column in the generated document. It never
stretches downward to acquire the content of its containing text fields. Its rendering
position is controlled by the isFloatColumnFooter flag declared at report template
level.
PAGE FOOTER
This section appears at the bottom of each page in the generated document. Just like the
column footer section, the page footer never stretches downwards to acquire the content
of its containing text fields and always retains the declared fixed height.
SUMMARY
This section is generated only once per report and appears at the end of the generated
document, but is not necessarily the last section generated. This is because in some cases
the column footer and/or page footer of the last page follows it.
As mentioned in “Report Template Properties” on page 42, you can have the summary
section start a new page of its own by setting the isSummaryNewPage attribute to true.
Even if this attribute remains false, the summary section always starts a new page if it
does not fit on the remaining space of the last page, or if the report has more than one
column and it has already started a second column on the last page.
LAST PAGE FOOTER
If present, this section replaces the normal page footer section, but only on the last
occurrence of the page footer, which might not be the last page if the summary is present
and it overflows on multiple pages or it is rendered alone on its own last page. So it
behaves more like the last page footer than the footer of the last page.
BACKGROUND
This is a special section that is rendered on all pages and its content placed underneath
all other report sections. Normal report sections are rendered one after the other, but the
background section does not interfere with the other report sections and can be used to
achieve watermark effects or to create the same background for all pages.
If the main report sections described here don’t meet your needs, you might consider
introducing supplementary sections like group headers and group footers.
The following section shows how to group data on the report.
NO DATA
This is another special section that is generated only once per report and, under certain
conditions, its content will replace all the ordinary report’s content.
Sometimes when the report data source is empty, is very useful to generate an equivalent
content, a notice, maybe, or an image, in order to replace all the empty zone. Especially
in the case of subreports, more useful is to replace all the subreport’s content with an
equivalent one.
If the ‘noData’ section is defined in the report template, and if the data source is empty,
then the ’noData‘ section will be the only one taken into account at fill time, and its
content will produce the report output.
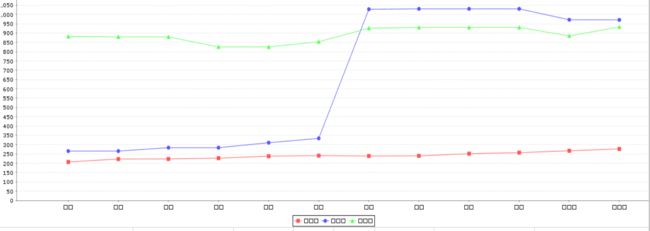
jasper导出图表

一个简单的柱状图, 怎么配置属性呢 在图表右键选择Edit Chart Wizard

Series
代表x轴每一个所对应的柱子个数, 也就是红蓝青三条柱子, 如果想要更多点击右侧...选择add即可
Category
x轴显示的值
Value
自然就是数量了
Label
单词意思是标签, 但是加了没发现有什么用不加会报错
X轴如何倾斜
点击图表在右侧Properties中找到 Chart Plot > Category Axis Tick Label Rotation 选择倾斜角度即可
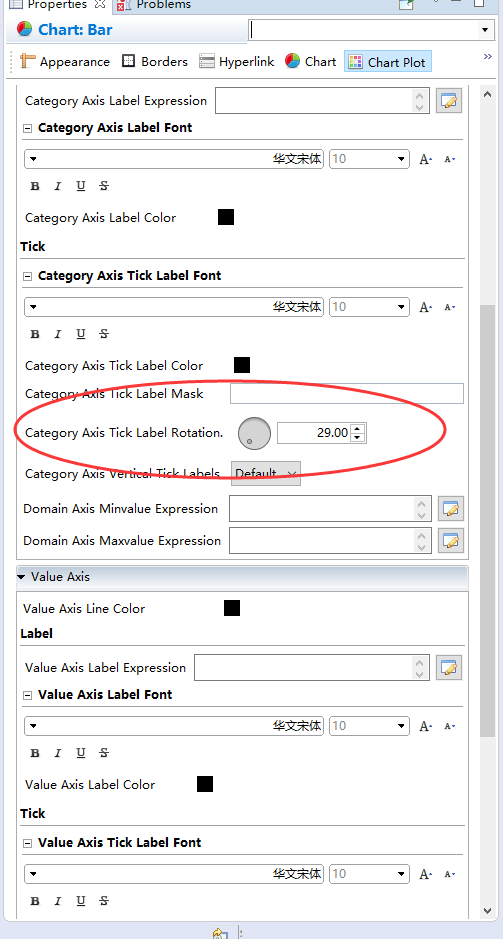
大家都知道在数据量大的情况下x轴如果不倾斜一个个字挤的可是很难看的, 话说我也是找了好久才找到这个属性
最后要注意的一点
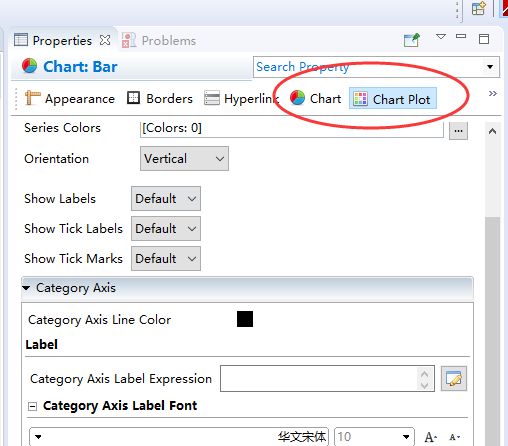
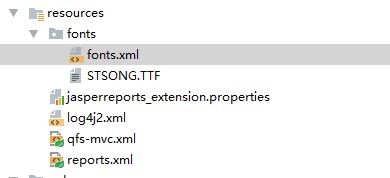
必须为这两个选项下的所有Font标签设置字体不然中文可是无法显示的, 就像这样
PDF显示中文问题项目中配置, PDF显示中文问题传送门
jasperreports_extension.properties
net.sf.jasperreports.extension.registry.factory.simple.font.families=net.sf.jasperreports.engine.fonts.SimpleFontExtensionsRegistryFactory
net.sf.jasperreports.extension.simple.font.families.lobstertwo=fonts/fonts.xml

此人博客有更详细jasper教程