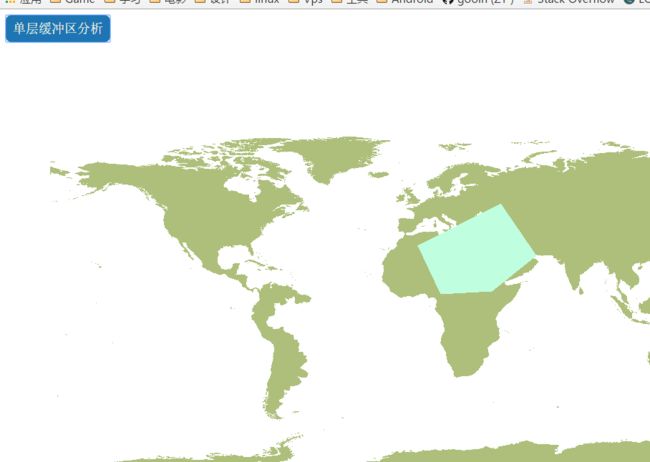
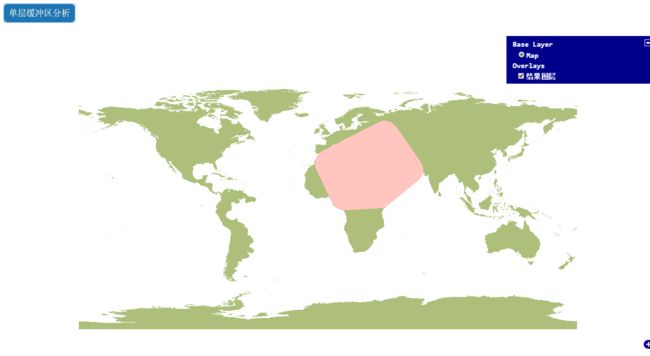
加载底图
请参考底部完整代码
单圈缓冲区分析
一.创建一个多边形
- 多点构成弧段
//            创建一个数组用于此存放点
        var points = new Array();
//              用for循环传入四个点的坐标
        points[0]=new Zondy.Object.Point2D(0.46, 30.1);
        points[1] = new Zondy.Object.Point2D(11.48, 6.22);
        points[2] = new Zondy.Object.Point2D(36.73, 7.6);
        points[3] = new Zondy.Object.Point2D(58.77, 25.51);
        points[4] = new Zondy.Object.Point2D(41, 51);

//            构成区要素的弧段
        var arc = new Zondy.Object.Arc(points);
//            构成折线的弧段
        var arc = new Zondy.Object.Arc(points);
- 多弧段构成折线
//            构成区要素的折线
        var anyLine = new Zondy.Object.AnyLine([arc]);
- 多折线构成区
////            构成区要素
        var gRegion = new Zondy.Object.GRegion([anyLine]);
创建区(合并代码)
//        创建多边形
        var gRegion = new Zondy.Object.GRegion([
            new Zondy.Object.AnyLine([
                new Zondy.Object.Arc([
                    new Zondy.Object.Point2D(0.46, 30.1),
                    new Zondy.Object.Point2D(11.48, 6.22),
                    new Zondy.Object.Point2D(36.73, 7.6),
                    new Zondy.Object.Point2D(58.77, 25.51),
                    new Zondy.Object.Point2D(41, 51)
                ])
            ])
        ]);
- 设置几何参数信息
//                创建构成区要素的几何信息
        var regGeom = new Zondy.Object.FeatureGeometry();
//        传入几何信息
        regGeom.setRegGeom([gRegion]);
- 设置图形参数信息(前面需要设置符号参数信息)
//            随机输出1-1502之间的整数

        var fillColor = Math.floor(Math.random() * 1502 + 1);

//            设置区的符号信息
        var cRegionInfo = new Zondy.Object.CRegionInfo({
            FillColor: fillColor //设置填充颜色
        });
//              设置图形参数
        var GraphicInfo = new Zondy.Object.WebGraphicsInfo({
            InfoType: 3,      //设为区类型
            RegInfo: cRegionInfo    //传入符号信息
        });
- 设置属性结构
//        设置属性结构
        var attStruct = new Zondy.Object.CAttStruct({
            FldName: ["ID", "周长", "面积", "name"],
            FldNumber: 4,
            FldType: ["long", "double", "double", "string"]
        });
- 设置属性值Value
//          设置属性值
        var attValue = [1234845, 45546, 4444444, "mdzz"];
        var valueRow = new Zondy.Object.CAttDataRow(attValue, 1);
- 创建要素
//            创建要素
        var feature = new Zondy.Object.Feature({
            fGeom: regGeom,                //传入几何信息
            GraphicInfo: GraphicInfo,       //传入图形参数信息
            AttValue: attValue               //传入属性值
        });
- 设置要素类型
//            将要素设置为区要素
        feature.setFType(3);
- 创建要素数据集(Zondy.Object.FeatureSet())
//            创建要素数据集
        var featureSet = new Zondy.Object.FeatureSet();
//            设置数据集的属性结构
        featureSet.AttStruct = attStruct;
//            将要素添加到数据集中
        featureSet.addFeature(feature);
- 创建编辑服务类
//          创建一个编辑服务类
        var editService = new Zondy.Service.EditLayerFeature("gdbp://MapGisLocal/OpenLayerVecterMap/ds/世界地图经纬度/sfcls/世界政区",
                {
                    ip: "127.0.0.1", //服务器ip
                    port: "6163"       //端口
                });

//     将要素数据集添加到图层中并使用回调函数
            editService.add(featureSet);
二.进行缓冲区分析
- 实例化单圈缓冲区分析对象
//        实例化单圈缓冲区分析对象
        var featureBuffBySR = new Zondy.Service.FeatureBuffBySingleRing({
            ip: "127.0.0.1",
            port: "6163",
            leftRad: 10,//左缓冲半径
            rightRad: 10 //右缓冲半径
        });
- 设置必要参数
        //设置必要参数
        featureBuffBySR.sfGeometryXML = $.toJSON([regGeom]); //几何信息
        featureBuffBySR.attStructXML = $.toJSON([attStruct]);//属性结构
        featureBuffBySR.attRowsXML = $.toJSON([valueRow]);//属性值
        featureBuffBySR.traceRadius = 0.0001;  //跟踪半径
//        设置生成的缓冲区要素的存放路径及文件名 //必填!!
        featureBuffBySR.resultName = "gdbp://MapGisLocal/OpenLayerVecterMap/sfcls/缓冲结果" + getCurrentTime();
- 执行缓冲(execute)
//          执行缓冲区分析并调用回调函数
        featureBuffBySR.execute(AnalysisSuccess);
- 回调函数内将图层添加并显示
//    回调函数
    function AnalysisSuccess(data) {
//          如果获取到结果
        if (data.results) {
//          如果获取的结果数组元素数量不为0
            if (data.results.length != 0) {
//                新建图层存储缓冲区分析结果
                var resultLayer = new Zondy.Map.Layer("结果图层", [data.results[0].Value], {
                    ip: '127.0.0.1',//ip
                    port: '6163',//端口
                    isBaseLayer: false//不为基础图层
                });
                map.addLayer(resultLayer);//将图层添加到地图容器中
            }
        } else {
            alert('缓冲失败,请检查参数');//弹窗提醒
        }
    }
获取当前时间函数
    //              获取当前时间函数
    function getCurrentTime() {
        //实例化一个日期对象
        var now = new Date();

        var year = now.getFullYear();   //四位数字返回年份。
        var month = now.getMonth() + 1; //月份 (0 ~ 11)。
        var day = now.getDate();        //一个月中的某一天 (1 ~ 31)

        var hh = now.getHours();        //获取小时 0-23
        var mm = now.getMinutes();      //获取分钟 0-59
        var ss = now.getSeconds();      //获取秒 0-59

//            定义一个对象存储时间
        var clock = year + "-";   //2016-

//            如果月份小于10则在月份前加0
        if (month < 10) clock += "0";
        clock += month + "-";      //2016-07-
//            如果天数小于10则在天数前加0
        if (day < 10) clock += "0";
        clock += day + "-";         //2016-07-27-
//            如果小时小于10则在小时前加0
        if (hh < 10) clock += "0";
        clock += hh;                //2016-07-27-21
//            如果分钟小于10则在分钟前加0
        if (mm < 10) clock += "0";
        clock += mm;                //2016-07-27-2135
//            如果秒数小于10则在秒数前加0
        if (ss < 10) clock += "0";
        clock += ss;                //2016-07-27-213523
//            返回clock的值
        return (clock);
    }
完整代码
Title

