下面你可以找到我们的朋友Peter Manev(Suricata核心团队)写的“Suricata(和开源IDPS的大满贯)”的文章,描述如何安装和配置PF_RING,DNA和Suricata。
原始的博客条目可以在第一部分 - PF_RING和第二部分 - DNA中找到。
第一部分 - PF_RING
如果您已安装pf_ring,则可能需要执行以下操作:
sudo rmmod pf_ring
如果您不确定是否安装了pf_ring,则可以执行以下操作:
sudo modinfo pf_ring
Get the latest pf_ring sources:
svn export https://svn.ntop.org/svn/ntop/trunk/PF_RING/ pfring-svn-latest
编译并安装PF_RING
接下来,输入以下命令进行配置和安装:
(!!! NOT AS ROOT !!!)
cd pfring-svn-latest/kernel
make && sudo make install
cd ../userland/lib
./configure –prefix=/usr/local/pfring && make && sudo make install
cd ../libpcap-1.1.1-ring
./configure –prefix=/usr/local/pfring && make && sudo make install
cd ../tcpdump-4.1.1
./configure –prefix=/usr/local/pfring && make && sudo make install
sudo ldconfig
Then we load the module:
sudo modprobe pf_ring
Elevate as root and check if you have everything you need -enter:
modinfo pf_ring && cat /proc/net/pf_ring/info
提高ixgbe模块的节流率:
modprobe ixgbe InterruptThrottleRate=4000
默认的pf_ring设置将如下所示:
root@suricata:/var/og/suricata# cat /proc/net/pf_ring/info
PF_RING Version          : 5.6.2 ($Revision: exported$)
Total rings              : 16
Standard (non DNA) Options
**Ring slots               : 4096
Slot version             : 15
Capture TX               : Yes [RX+TX]
IP Defragment            : No
Socket Mode              : Standard
Transparent mode         : Yes [mode 0]
Total plugins            : 0
Cluster Fragment Queue   : 0
Cluster Fragment Discard : 0
注意上面的环形槽。 为了满足我们要用Suricata监测的高速网络的需求,我们实际上希望增加这个功能。
我们可以这样做:
rmmod pf_ring
modprobe pf_ring transparent_mode=0 min_num_slots=65534

root@suricata:/home/pevman/pfring-svn-latest# modprobe pf_ring transparent_mode=0 min_num_slots=65534
root@suricata:/home/pevman/pfring-svn-latest# cat /proc/net/pf_ring/info
PF_RING Version          : 5.6.2 ($Revision: exported$)
Total rings              : 0
Standard (non DNA) Options
Ring slots               : 65534
Slot version             : 15
Capture TX               : Yes [RX+TX]
IP Defragment            : No
Socket Mode              : Standard
Transparent mode         : Yes [mode 0]
Total plugins            : 0
Cluster Fragment Queue   : 0
Cluster Fragment Discard : 0
Notice the difference above  – Ring slots: 65534
启用PF_RING编译安装 Suricata 得到最新的版本:
git clone git://phalanx.openinfosecfoundation.org/oisf.git && cd
oisf/ &&  git clone https://github.com/ironbee/libhtp.git -b
0.5.x
编译和安装
./autogen.sh && LIBS=-lrt ./configure –enable-pfring –enable-geoip \
–with-libpfring-includes=/usr/local/pfring/include/ \
–with-libpfring-libraries=/usr/local/pfring/lib/ \
–with-libpcap-includes=/usr/local/pfring/include/ \
–with-libpcap-libraries=/usr/local/pfring/lib/ \
–with-libnss-libraries=/usr/lib \
–with-libnss-includes=/usr/include/nss/ \
–with-libnspr-libraries=/usr/lib \
–with-libnspr-includes=/usr/include/nspr \
&& sudo make clean && sudo make && sudo make install && sudo ldconfig
The “LIBS=-lrt” infront of “./configure” above is in case you get the following error without the use of “LIBS=-lrt ” :
checking for pfring_open in -lpfring... no
ERROR! --enable-pfring was passed but the library was not found or version is >4, go get it
from https://www.ntop.org/PF_RING.html
PF_RING – suricata.yaml 配置
缺省suricata.yaml中的以下值和变量需要更改 - >
我们确保我们使用runmode worker(随意尝试其他模式,并试验什么是最适合您的具体设置):
#runmode: autofp
runmode: workers
调整数据包大小:
# Preallocated size for packet. Default is 1514 which is the classical
# size for pcap on ethernet. You should adjust this value to the highest
# packet size (MTU + hardware header) on your system.
default-packet-size: 1522
Use custom profile in detect-engine with a lot more groups (high gives you about 15 groups per variable, but you can customize as needed depending on the network ranges you monitor ):
detect-engine:
– profile: custom
– custom-values:
toclient-src-groups: 200
toclient-dst-groups: 200
toclient-sp-groups: 200
toclient-dp-groups: 300
toserver-src-groups: 200
toserver-dst-groups: 400
toserver-sp-groups: 200
toserver-dp-groups: 250
– sgh-mpm-context: full
– inspection-recursion-limit: 3000
调整defrag 配置:
# Defrag settings:
defrag:
memcap: 512mb
hash-size: 65536
trackers: 65535 # number of defragmented flows to follow
max-frags: 65535 # number of fragments to keep
prealloc: yes
timeout: 30
调整你 flow 配置:
flow:
memcap: 1gb
hash-size: 1048576
prealloc: 1048576
emergency-recovery: 30
调整你协议超时配置:
flow-timeouts:
default:
new: 3
established: 30
closed: 0
emergency-new: 10
emergency-established: 10
emergency-closed: 0
tcp:
new: 6
established: 100
closed: 12
emergency-new: 1
emergency-established: 5
emergency-closed: 2
udp:
new: 3
established: 30
emergency-new: 3
emergency-established: 10
icmp:
new: 3
established: 30
emergency-new: 1
emergency-established: 10
调整您的流引擎设置:
stream:
memcap: 12gb
checksum-validation: no      # reject wrong csums
prealloc-sesions: 500000     #per thread
midstream: true
asyn-oneside: true
inline: no                  # auto will use inline mode in IPS mode, yes or no set it statically
reassembly:
memcap: 20gb
depth: 12mb                  # reassemble 12mb into a stream
toserver-chunk-size: 2560
toclient-chunk-size: 2560
randomize-chunk-size: yes
#randomize-chunk-range: 10
如果出现问题,请确保启用suricata.log进行故障排除:
outputs:
– console:
enabled: yes
– file:
enabled: yes
filename: /var/log/suricata/suricata.log
PF_RING 段配置:
# PF_RING configuration. for use with native PF_RING support
# for more info see https://www.ntop.org/PF_RING.html
pfring:
– interface: eth3
# Number of receive threads (>1 will enable experimental flow pinned
# runmode)
threads: 16
# Default clusterid.  PF_RING will load balance packets based on flow.
# All threads/processes that will participate need to have the same
# clusterid.
cluster-id: 99

# Default PF_RING cluster type. PF_RING can load balance per flow or per hash.
# This is only supported in versions of PF_RING > 4.1.1.
cluster-type: cluster_flow
# bpf filter for this interface
#bpf-filter: tcp
# Choose checksum verification mode for the interface. At the moment
# of the capture, some packets may be with an invalid checksum due to
# offloading to the network card of the checksum computation.
# Possible values are:
#  – rxonly: only compute checksum for packets received by network card.
#  – yes: checksum validation is forced
#  – no: checksum validation is disabled
#  – auto: suricata uses a statistical approach to detect when
#  checksum off-loading is used. (default)
# Warning: ‘checksum-validation’ must be set to yes to have any validation
#checksum-checks: auto
我们让下面规则启用:
rule-files:
 – md5.rules # 134 000 specially selected file md5s
– dns.rules
– malware.rules
– local.rules
– current_events.rules
– mobile_malware.rules
– user_agents.rules
确保你调整你的网络和端口变量:
 # Holds the address group vars that would be passed in a Signature.
# These would be retrieved during the Signature address parsing stage.

address-groups:
HOME_NET: “[ HOME NET HERE ]”
EXTERNAL_NET: “!$HOME_NET”
HTTP_SERVERS: “$HOME_NET”
SMTP_SERVERS: “$HOME_NET”
SQL_SERVERS: “$HOME_NET”
DNS_SERVERS: “$HOME_NET”
TELNET_SERVERS: “$HOME_NET”
AIM_SERVERS: “$EXTERNAL_NET”
DNP3_SERVER: “$HOME_NET”
DNP3_CLIENT: “$HOME_NET”
MODBUS_CLIENT: “$HOME_NET”
MODBUS_SERVER: “$HOME_NET”
ENIP_CLIENT: “$HOME_NET”
ENIP_SERVER: “$HOME_NET”
# Holds the port group vars that would be passed in a Signature.
# These would be retrieved during the Signature port parsing stage.
port-groups:
HTTP_PORTS: “80”
SHELLCODE_PORTS: “!80”
ORACLE_PORTS: 1521
SSH_PORTS: 22
DNP3_PORTS: 20000

Your app parsers:
# Holds details on the app-layer. The protocols section details each protocol.
# Under each protocol, the default value for detection-enabled and ”
# parsed-enabled is yes, unless specified otherwise.
# Each protocol covers enabling/disabling parsers for all ipprotos
# the app-layer protocol runs on.  For example “dcerpc” refers to the tcp
# version of the protocol as well as the udp version of the protocol.
# The option “enabled” takes 3 values – “yes”, “no”, “detection-only”.
# “yes” enables both detection and the parser, “no” disables both, and
# “detection-only” enables detection only(parser disabled).
app-layer:
protocols:
tls:
enabled: yes
detection-ports:
tcp:
toserver: 443
#no-reassemble: yes
dcerpc:
enabled: yes
ftp:
enabled: yes
ssh:
enabled: yes

smtp:
enabled: yes
imap:
enabled: detection-only
msn:
enabled: detection-only
smb:
enabled: yes
detection-ports:
tcp:
toserver: 139
# smb2 detection is disabled internally inside the engine.
#smb2:
#  enabled: yes
dnstcp:
enabled: yes
detection-ports:
tcp:
toserver: 53
dnsudp:
enabled: yes
detection-ports:
udp:
toserver: 53
http:
enabled: yes
Libhtp body limits:
libhtp:
default-config:
personality: IDS
# Can be specified in kb, mb, gb.  Just a number indicates
# it’s in bytes.
request-body-limit: 12mb
response-body-limit: 12mb
# inspection limits
request-body-minimal-inspect-size: 32kb
request-body-inspect-window: 4kb
response-body-minimal-inspect-size: 32kb
response-body-inspect-window: 4kb
运行
完成所有的工作,你可以像这样开始Suricata(改变你的目录位置等等)
 LD_LIBRARY_PATH=/usr/local/pfring/lib suricata –pfring-int=eth3 \
–pfring-cluster-id=99 –pfring-cluster-type=cluster_flow \
-c /etc/suricata/peter-yaml/suricata-pfring.yaml -D -v
下面的命令也一样可以工作:
suricata –pfring-int=eth3  –pfring-cluster-id=99 –pfring-cluster-type=cluster_flow \
-c /etc/suricata/peter-yaml/suricata-pfring.yaml -D -v
在用PF_RING启动Suricata后,可以使用htop和suricata.log的日志信息来确定是否一切正常
例:
[29966] 30/11/2013 — 14:29:12 – (util-cpu.c:170)  (UtilCpuPrintSummary) — CPUs/cores online: 16

[29966] 30/11/2013 — 14:29:12 – (app-layer-dns-udp.c:315)  (DNSUDPConfigure) — DNS request flood protection level: 500

[29966] 30/11/2013 — 14:29:12 – (defrag-hash.c:212)  (DefragInitConfig) — allocated 3670016 bytes of memory for the defrag hash… 65536 buckets of size 56

[29966] 30/11/2013 — 14:29:12 – (defrag-hash.c:237)  (DefragInitConfig) — preallocated 65535 defrag trackers of size 152

[29966] 30/11/2013 — 14:29:12 – (defrag-hash.c:244)  (DefragInitConfig) — defrag memory usage: 13631336 bytes, maximum: 536870912

[29966] 30/11/2013 — 14:29:12 – (tmqh-flow.c:76)  (TmqhFlowRegister) — AutoFP mode using default “Active Packets” flow load balancer

[29967] 30/11/2013 — 14:29:12 – (tmqh-packetpool.c:141)  (PacketPoolInit) — preallocated 65534 packets. Total memory 229106864

[29967] 30/11/2013 — 14:29:12 – (host.c:205)  (HostInitConfig) — allocated 262144 bytes of memory for the host hash… 4096 buckets of size 64

[29967] 30/11/2013 — 14:29:12 – (host.c:228)  (HostInitConfig) — preallocated 1000 hosts of size 112

[29967] 30/11/2013 — 14:29:12 – (host.c:230)  (HostInitConfig) — host memory usage: 390144 bytes, maximum: 16777216

[29967] 30/11/2013 — 14:29:12 – (flow.c:386)  (FlowInitConfig) — allocated 67108864 bytes of memory for the flow hash… 1048576 buckets of size 64

[29967] 30/11/2013 — 14:29:13 – (flow.c:410)  (FlowInitConfig) — preallocated 1048576 flows of size 280

[29967] 30/11/2013 — 14:29:13 – (flow.c:412)  (FlowInitConfig) — flow memory usage: 369098752 bytes, maximum: 1073741824

…..

[29967] 30/11/2013 — 14:30:23 – (util-runmodes.c:545)  (RunModeSetLiveCaptureWorkersForDevice) — Going to use 16 thread(s)

[30000] 30/11/2013 — 14:30:23 – (source-pfring.c:445)  (ReceivePfringThreadInit) — (RxPFReth31) Using PF_RING v.5.6.2, interface eth3, cluster-id 99

[30001] 30/11/2013 — 14:30:23 – (source-pfring.c:445)  (ReceivePfringThreadInit) — (RxPFReth32) Using PF_RING v.5.6.2, interface eth3, cluster-id 99

[30002] 30/11/2013 — 14:30:23 – (source-pfring.c:445)  (ReceivePfringThreadInit) — (RxPFReth33) Using PF_RING v.5.6.2, interface eth3, cluster-id 99

[30003] 30/11/2013 — 14:30:23 – (source-pfring.c:445)  (ReceivePfringThreadInit) — (RxPFReth34) Using PF_RING v.5.6.2, interface eth3, cluster-id 99

[30004] 30/11/2013 — 14:30:24 – (source-pfring.c:445)  (ReceivePfringThreadInit) — (RxPFReth35) Using PF_RING v.5.6.2, interface eth3, cluster-id 99

[30005] 30/11/2013 — 14:30:24 – (source-pfring.c:445)  (ReceivePfringThreadInit) — (RxPFReth36) Using PF_RING v.5.6.2, interface eth3, cluster-id 99

[30006] 30/11/2013 — 14:30:24 – (source-pfring.c:445)  (ReceivePfringThreadInit) — (RxPFReth37) Using PF_RING v.5.6.2, interface eth3, cluster-id 99

[30007] 30/11/2013 — 14:30:24 – (source-pfring.c:445)  (ReceivePfringThreadInit) — (RxPFReth38) Using PF_RING v.5.6.2, interface eth3, cluster-id 99

[30008] 30/11/2013 — 14:30:24 – (source-pfring.c:445)  (ReceivePfringThreadInit) — (RxPFReth39) Using PF_RING v.5.6.2, interface eth3, cluster-id 99

[30009] 30/11/2013 — 14:30:24 – (source-pfring.c:445)  (ReceivePfringThreadInit) — (RxPFReth310) Using PF_RING v.5.6.2, interface eth3, cluster-id 99

[30010] 30/11/2013 — 14:30:24 – (source-pfring.c:445)  (ReceivePfringThreadInit) — (RxPFReth311) Using PF_RING v.5.6.2, interface eth3, cluster-id 99

[30011] 30/11/2013 — 14:30:24 – (source-pfring.c:445)  (ReceivePfringThreadInit) — (RxPFReth312) Using PF_RING v.5.6.2, interface eth3, cluster-id 99

[30012] 30/11/2013 — 14:30:24 – (source-pfring.c:445)  (ReceivePfringThreadInit) — (RxPFReth313) Using PF_RING v.5.6.2, interface eth3, cluster-id 99

[30013] 30/11/2013 — 14:30:24 – (source-pfring.c:445)  (ReceivePfringThreadInit) — (RxPFReth314) Using PF_RING v.5.6.2, interface eth3, cluster-id 99

[30014] 30/11/2013 — 14:30:25 – (source-pfring.c:445)  (ReceivePfringThreadInit) — (RxPFReth315) Using PF_RING v.5.6.2, interface eth3, cluster-id 99

[30015] 30/11/2013 — 14:30:25 – (source-pfring.c:445)  (ReceivePfringThreadInit) — (RxPFReth316) Using PF_RING v.5.6.2, interface eth3, cluster-id 99

[29967] 30/11/2013 — 14:30:25 – (runmode-pfring.c:555)  (RunModeIdsPfringWorkers) — RunModeIdsPfringWorkers initialised

…..

[29967] 30/11/2013 — 14:30:25 – (tm-threads.c:2191)  (TmThreadWaitOnThreadInit) — all 16 packet processing threads, 3 management threads initialized, engine started.
So after running for about 7 hrs:

root@suricata:/var/log/suricata# grep kernel stats.log |tail -32
capture.kernel_packets    | RxPFReth31                | 2313986783
capture.kernel_drops      | RxPFReth31                | 75254447
capture.kernel_packets    | RxPFReth32                | 2420204427
capture.kernel_drops      | RxPFReth32                | 23492323
capture.kernel_packets    | RxPFReth33                | 2412343682
capture.kernel_drops      | RxPFReth33                | 71202459
capture.kernel_packets    | RxPFReth34                | 2249712177
capture.kernel_drops      | RxPFReth34                | 15290216
capture.kernel_packets    | RxPFReth35                | 2272653367
capture.kernel_drops      | RxPFReth35                | 2072826
capture.kernel_packets    | RxPFReth36                | 2281254066
capture.kernel_drops      | RxPFReth36                | 118723669
capture.kernel_packets    | RxPFReth37                | 2430047882
capture.kernel_drops      | RxPFReth37                | 13702511
capture.kernel_packets    | RxPFReth38                | 2474713911
capture.kernel_drops      | RxPFReth38                | 6512062
capture.kernel_packets    | RxPFReth39                | 2299221265
capture.kernel_drops      | RxPFReth39                | 596690
capture.kernel_packets    | RxPFReth310               | 2398183554
capture.kernel_drops      | RxPFReth310               | 15623971
capture.kernel_packets    | RxPFReth311               | 2277348230
capture.kernel_drops      | RxPFReth311               | 62773742
capture.kernel_packets    | RxPFReth312               | 2693710052
capture.kernel_drops      | RxPFReth312               | 40213266
capture.kernel_packets    | RxPFReth313               | 2470037871
capture.kernel_drops      | RxPFReth313               | 406738
capture.kernel_packets    | RxPFReth314               | 2236636480
capture.kernel_drops      | RxPFReth314               | 714360
capture.kernel_packets    | RxPFReth315               | 2314829059
capture.kernel_drops      | RxPFReth315               | 1818726
capture.kernel_packets    | RxPFReth316               | 2271917603
capture.kernel_drops      | RxPFReth316               | 1200009
约2%drop,85%的CPU使用率,约3300条规则,并检查匹配134000文件MD5的流量。
注意
你也可以使用linux-tools进行更多的分析和性能调优:
apt-get安装linux-tools
例如:perf top
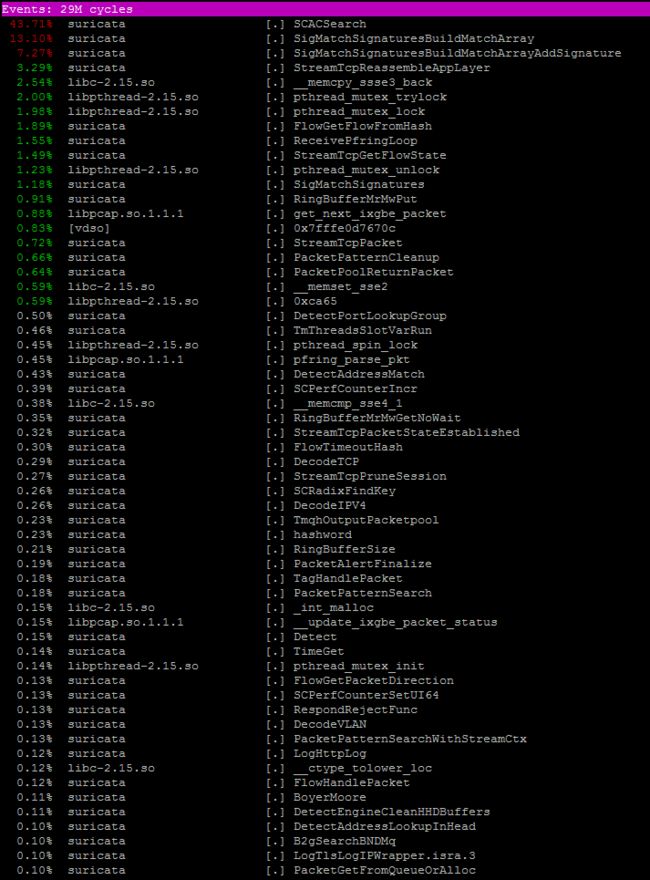
在这里找到更多的信息,并感谢Regit HERE。
您的调音任务尚未完成。 您也可以在Suricata中启用剖析功能来执行干式测试,并确定最“昂贵的规则”并相应调整它们。
第二部分 - DNA
如果您的系统中没有安装PF_RING,则应遵循“运行”一节中的所有第一部分。 之后回来,从这里继续。
注意:了解你的网卡。 此设置使用英特尔82599EB万兆SFI / SFP +
注意:当一个应用程序使用DNA接口时,其他应用程序不能使用相同的接口。 例如,如果您有Suricata在本指南中运行,如果您想执行“./pfcount”,您将无法执行此操作,因为DNA界面已被应用程序使用。 如果您希望多个应用程序使用相同的DNA界面,您应该考虑Libzero。
编译
一旦你获得了你的DNA许可证(许可证中包括“如何”的说明),请cd到你最近的pfring pull的src:
cd /home/pevman/pfring-svn-latest/drivers/DNA/ixgbe-3.18.7-DNA/src
使配置提升为root。
编辑在下面的目录中找到的脚本load_dna_driver.sh
(/pfring-svn-latest/drivers/DNA/ixgbe-3.18.7-DNA/src/load_dna_driver.sh)
在脚本load_dna_driver.sh中进行更改(我们只使用一个dna接口):
# Configure here the network interfaces to activate
IF[0]=dna0
#IF[1]=dna1
#IF[2]=dna2
#IF[3]=dna3
Leave rmmod like so (default):
# Remove old modules (if loaded)
rmmod ixgbe
rmmod pf_ring
Leave only two insmod lines uncommented
# We assume that you have compiled PF_RING
insmod ../../../../kernel/pf_ring.ko
Adjust the queues, use your own MAC address, increase the buffers, up the laser on the SFP:
# As many queues as the number of processors
#insmod ./ixgbe.ko RSS=0,0,0,0
insmod ./ixgbe.ko RSS=0 mtu=1522 adapters_to_enable=00:e0:ed:19:e3:e1 num_rx_slots=32768 FdirPballoc=3
上面我们有16个CPU,我们要使用16个队列,只用这个MAC地址启用这个适配器,打开Rx插槽并注释所有其他的insmod行(除了上面显示的这两个pf_ring.ko和ixgbe.ko)
在上面的例子中,我们为10Gbps Intel网卡的第一个端口启用了16个队列(导致我们有16个cpu)。
+++++角落案例+++++
(奖金回合!! - 在ntop的Alfredo Cardigliano的帮助下)
#####Question:

So what should you do if you have this scenario – 32 core system with a
10Gbps network card and DNA. The card has  4 ports each port getting 1,2,6,1 Gbps
of traffic, respectivelly.
You would like to get 4,8 16,4 queues – dedicated cpus (as written ) per
port. In other words:
Gbps of traffic (port 0,1,2,3) – >            1,2,6,1
Number of cpus/queues dedicated – >  4,8,16,4
#####Answer:
Simple -> You should use
insmod ./ixgbe.ko RSS=4,8,16,4 ….
instead of :
insmod ./ixgbe.ko RSS=0 ….
+++++ END of the CORNER CASE +++++
Execute load_dna_driver.sh from the same directory it resides in.
(ex for this tutorial – /home/pevman/pfring-svn-latest/drivers/DNA/ixgbe-3.18.7-DNA/src) :
./ load_dna_driver.sh
Make sure offloading is disabled (substitute the correct interface name below name):
ethtool -K dna0 tso off
ethtool -K dna0 gro off
ethtool -K dna0 lro off
ethtool -K dna0 gso off
ethtool -K dna0 rx off
ethtool -K dna0 tx off
ethtool -K dna0 sg off
ethtool -K dna0 rxvlan off
ethtool -K dna0 txvlan off
ethtool -N dna0 rx-flow-hash udp4 sdfn
ethtool -N dna0 rx-flow-hash udp6 sdfn
ethtool -n dna0 rx-flow-hash udp6
ethtool -n dna0 rx-flow-hash udp4
ethtool -C dna0 rx-usecs 1000
ethtool -C dna0 adaptive-rx off
suricata.yaml的配置
在suricata.yaml中,确保您的pfring部分如下所示:
# PF_RING configuration. for use with native PF_RING support
# for more info see https://www.ntop.org/PF_RING.html  #dna0@0
pfring:
– interface: dna0@0
# Number of receive threads (>1 will enable experimental flow pinned
# runmode)
#threads: 1
# Default clusterid.  PF_RING will load balance packets based on flow.
# All threads/processes that will participate need to have the same
# clusterid.
#cluster-id: 1
# Default PF_RING cluster type. PF_RING can load balance per flow or per hash.
# This is only supported in versions of PF_RING > 4.1.1.
cluster-type: cluster_flow
# bpf filter for this interface
#bpf-filter: tcp
# Choose checksum verification mode for the interface. At the moment
# of the capture, some packets may be with an invalid checksum due to
# offloading to the network card of the checksum computation.
# Possible values are:
#  – rxonly: only compute checksum for packets received by network card.
#  – yes: checksum validation is forced
#  – no: checksum validation is disabled
#  – auto: suricata uses a statistical approach to detect when
#  checksum off-loading is used. (default)
# Warning: ‘checksum-validation’ must be set to yes to have any validation
#checksum-checks: auto
# Second interface
– interface: dna0@1
threads: 1
– interface: dna0@2
threads: 1
– interface: dna0@3
threads: 1
– interface: dna0@4
threads: 1
– interface: dna0@5
threads: 1
– interface: dna0@6
threads: 1
– interface: dna0@7
threads: 1
– interface: dna0@8
threads: 1
– interface: dna0@9
threads: 1
– interface: dna0@10
threads: 1
– interface: dna0@11
threads: 1
– interface: dna0@12
threads: 1
– interface: dna0@13
threads: 1
– interface: dna0@14
threads: 1
– interface: dna0@15
threads: 1
# Put default values here
#- interface: default
#threads: 2
Rules enabled in suricata.yaml:
default-rule-path: /etc/suricata/et-config/
rule-files:
– trojan.rules
– dns.rules
– malware.rules
– local.rules
– jonkman.rules
– worm.rules
– current_events.rules
– mobile_malware.rules
– user_agents.rules
Start Suricata with DNA
(确保你在下面的命令中调整你的目录)
suricata –pfring -c /etc/suricata/peter-yaml/suricata-pfring-dna.yaml -v -D
来自suricata.log的一些统计数据:
root@suricata:/home/pevman/pfring-svn-latest/userland/examples#
more /var/log/suricata/suricata.log
[32055] 27/11/2013 — 13:31:38 – (suricata.c:932)(SCPrintVersion) — This is Suricata version 2.0dev (rev 77b09fc)
[32055] 27/11/2013 — 13:31:38 – (util-cpu.c:170)(UtilCpuPrintSummary) — CPUs/cores online: 16
[32055] 27/11/2013 — 13:31:38 – (app-layer-dns-udp.c:315)(DNSUDPConfigure) — DNS request flood protection level: 500
[32055] 27/11/2013 — 13:31:38 – (defrag-hash.c:209)(DefragInitConfig) — allocated 3670016 bytes of memory for the defrag hash… 65536 buckets of size 56
[32055] 27/11/2013 — 13:31:38 – (defrag-hash.c:234)(DefragInitConfig) — preallocated 65535 defrag trackers of size 152
[32055] 27/11/2013 — 13:31:38 – (defrag-hash.c:241)(DefragInitConfig) — defrag memory usage: 13631336 bytes, maximum: 536870912
[32055] 27/11/2013 — 13:31:38 – (tmqh-flow.c:76)(TmqhFlowRegister) — AutoFP mode using default “Active Packets” flow load balancer
[32056] 27/11/2013 — 13:31:38 – (tmqh-packetpool.c:141)(PacketPoolInit) — preallocated 65534 packets. Total memory 288873872
[32056] 27/11/2013 — 13:31:38 – (host.c:205)(HostInitConfig) — allocated 262144 bytes of memory for the host hash… 4096 buckets of size 64
[32056] 27/11/2013 — 13:31:38 – (host.c:228)(HostInitConfig) — preallocated 1000 hosts of size 112
[32056] 27/11/2013 — 13:31:38 – (host.c:230)(HostInitConfig) — host memory usage: 390144 bytes, maximum: 16777216
[32056] 27/11/2013 — 13:31:38 – (flow.c:386)(FlowInitConfig) — allocated 67108864 bytes of memory for the flow hash… 1048576 buckets of size 64
[32056] 27/11/2013 — 13:31:38 – (flow.c:410)(FlowInitConfig) — preallocated 1048576 flows of size 376
[32056] 27/11/2013 — 13:31:38 – (flow.c:412)(FlowInitConfig) — flow memory usage: 469762048 bytes, maximum: 1073741824
[32056] 27/11/2013 — 13:31:38 – (reputation.c:459)(SRepInit) — IP reputation disabled
[32056] 27/11/2013 — 13:31:38 – (util-magic.c:62)(MagicInit) — using magic-file /usr/share/file/magic
[32056] 27/11/2013 — 13:31:38 – (suricata.c:1725)(SetupDelayedDetect) — Delayed detect disabled
…..rules loaded – 8010 :
[32056] 27/11/2013 — 13:31:40 – (detect.c:453)
(SigLoadSignatures) — 9 rule files processed. 8010 rules successfully loaded, 0 rules failed
[32056] 27/11/2013 — 13:31:40 – (detect.c:2589)(SigAddressPrepareStage1) — 8017 signatures processed. 1 are IP-only rules, 2147 are inspecting packet payload, 6625 inspect application layer, 0 are decoder event only
[32056] 27/11/2013 — 13:31:40 – (detect.c:2592)(SigAddressPrepareStage1) — building signature grouping structure, stage 1: adding signatures to signature source addresses… complete
[32056] 27/11/2013 — 13:31:40 – (detect.c:3218)(SigAddressPrepareStage2) — building signature grouping structure, stage 2: building source address list… complete
[32056] 27/11/2013 — 13:35:28 – (detect.c:3860)(SigAddressPrepareStage3) — building signature grouping structure, stage 3: building destination address lists… complete
[32056] 27/11/2013 — 13:35:28 – (util-threshold-config.c:1186)(SCThresholdConfParseFile) — Threshold config parsed: 0 rule(s) found
[32056] 27/11/2013 — 13:35:28 – (util-coredump-config.c:122)(CoredumpLoadConfig) — Core dump size set to unlimited.
[32056] 27/11/2013 — 13:35:28 – (util-logopenfile.c:168)(SCConfLogOpenGeneric) — fast output device (regular) initialized: fast.log
[32056] 27/11/2013 — 13:35:28 – (util-logopenfile.c:168)(SCConfLogOpenGeneric) — http-log output device (regular) initialized: http.log
[32056] 27/11/2013 — 13:35:28 – (util-logopenfile.c:168)(SCConfLogOpenGeneric) — tls-log output device (regular) initialized: tls.log
[32056] 27/11/2013 — 13:35:28 – (util-device.c:147)(LiveBuildDeviceList) — Adding interface dna0@0 from config file
[32056] 27/11/2013 — 13:35:28 – (util-device.c:147)(LiveBuildDeviceList) — Adding interface dna0@1 from config file
[32056] 27/11/2013 — 13:35:28 – (util-device.c:147)(LiveBuildDeviceList) — Adding interface dna0@2 from config file
[32056] 27/11/2013 — 13:35:28 – (util-device.c:147)(LiveBuildDeviceList) — Adding interface dna0@3 from config file
[32056] 27/11/2013 — 13:35:28 – (util-device.c:147)(LiveBuildDeviceList) — Adding interface dna0@4 from config file
[32056] 27/11/2013 — 13:35:28 – (util-device.c:147)(LiveBuildDeviceList) — Adding interface dna0@5 from config file
[32056] 27/11/2013 — 13:35:28 – (util-device.c:147)(LiveBuildDeviceList) — Adding interface dna0@6 from config file
[32056] 27/11/2013 — 13:35:28 – (util-device.c:147)(LiveBuildDeviceList) — Adding interface dna0@7 from config file
[32056] 27/11/2013 — 13:35:28 – (util-device.c:147)(LiveBuildDeviceList) — Adding interface dna0@8 from config file
[32056] 27/11/2013 — 13:35:28 – (util-device.c:147)(LiveBuildDeviceList) — Adding interface dna0@9 from config file
[32056] 27/11/2013 — 13:35:28 – (util-device.c:147)(LiveBuildDeviceList) — Adding interface dna0@10 from config file
[32056] 27/11/2013 — 13:35:28 – (util-device.c:147)(LiveBuildDeviceList) — Adding interface dna0@11 from config file
[32056] 27/11/2013 — 13:35:28 – (util-device.c:147)(LiveBuildDeviceList) — Adding interface dna0@12 from config file
[32056] 27/11/2013 — 13:35:28 – (util-device.c:147)(LiveBuildDeviceList) — Adding interface dna0@13 from config file
[32056] 27/11/2013 — 13:35:28 – (util-device.c:147)(LiveBuildDeviceList) — Adding interface dna0@14 from config file
[32056] 27/11/2013 — 13:35:28 – (util-device.c:147)(LiveBuildDeviceList) — Adding interface dna0@15 from config file
……[32056] 27/11/2013 — 13:35:28 – (runmode-pfring.c:555)
(RunModeIdsPfringWorkers) — RunModeIdsPfringWorkers initialised [32056] 27/11/2013 — 13:35:28 – (stream-tcp.c:374)
(StreamTcpInitConfig) — stream “prealloc-sessions”: 2048 (per thread) [32056] 27/11/2013 — 13:35:28 – (stream-tcp.c:390)
(StreamTcpInitConfig) — stream “memcap”: 17179869184 [32056] 27/11/2013 — 13:35:28 – (stream-tcp.c:396)
(StreamTcpInitConfig) — stream “midstream” session pickups: enabled [32056] 27/11/2013 — 13:35:28 – (stream-tcp.c:402)
(StreamTcpInitConfig) — stream “async-oneside”: disabled [32056] 27/11/2013 — 13:35:28 – (stream-tcp.c:419)
(StreamTcpInitConfig) — stream “checksum-validation”: disabled [32056] 27/11/2013 — 13:35:28 – (stream-tcp.c:441)
(StreamTcpInitConfig) — stream.”inline”: disabled [32056] 27/11/2013 — 13:35:28 – (stream-tcp.c:454)
(StreamTcpInitConfig) — stream “max-synack-queued”: 5 [32056] 27/11/2013 — 13:35:28 – (stream-tcp.c:472)
(StreamTcpInitConfig) — stream.reassembly “memcap”: 25769803776 [32056] 27/11/2013 — 13:35:28 – (stream-tcp.c:490)
(StreamTcpInitConfig) — stream.reassembly “depth”: 12582912 [32056] 27/11/2013 — 13:35:28 – (stream-tcp.c:573)
(StreamTcpInitConfig) — stream.reassembly “toserver-chunk-size”: 2509 [32056] 27/11/2013 — 13:35:28 – (stream-tcp.c:575)
(StreamTcpInitConfig) — stream.reassembly “toclient-chunk-size”: 2459 [32056] 27/11/2013 — 13:35:28 – (tm-threads.c:2191)
(TmThreadWaitOnThreadInit) - 全部16个数据包处理线程,3个管理线程初始化,引擎启动。
结果:在10Gbps 8010规则(令人印象深刻)运行45分钟后(和计数)->
root@suricata:/var/log/suricata# grep kernel /var/log/suricata/stats.log | tail -32
capture.kernel_packets | RxPFRdna0@01 | 467567844
capture.kernel_drops | RxPFRdna0@01 | 0
capture.kernel_packets | RxPFRdna0@11 | 440973548
capture.kernel_drops | RxPFRdna0@11 | 0
capture.kernel_packets | RxPFRdna0@21 | 435088258
capture.kernel_drops | RxPFRdna0@21 | 0
capture.kernel_packets | RxPFRdna0@31 | 453131090
capture.kernel_drops | RxPFRdna0@31 | 0
capture.kernel_packets | RxPFRdna0@41 | 469334903
capture.kernel_drops | RxPFRdna0@41 | 0
capture.kernel_packets | RxPFRdna0@51 | 430412652
capture.kernel_drops | RxPFRdna0@51 | 0
capture.kernel_packets | RxPFRdna0@61 | 438056484
capture.kernel_drops | RxPFRdna0@61 | 0
capture.kernel_packets | RxPFRdna0@71 | 428234219
capture.kernel_drops | RxPFRdna0@71 | 0
capture.kernel_packets | RxPFRdna0@81 | 452883734
capture.kernel_drops | RxPFRdna0@81 | 0
capture.kernel_packets | RxPFRdna0@91 | 469565553
capture.kernel_drops | RxPFRdna0@91 | 0
capture.kernel_packets | RxPFRdna0@101 | 442010263
capture.kernel_drops | RxPFRdna0@101 | 0
capture.kernel_packets | RxPFRdna0@111 | 451989862
capture.kernel_drops | RxPFRdna0@111 | 0
capture.kernel_packets | RxPFRdna0@121 | 452650397
capture.kernel_drops | RxPFRdna0@121 | 0
capture.kernel_packets | RxPFRdna0@131 | 464907229
capture.kernel_drops | RxPFRdna0@131 | 0
capture.kernel_packets | RxPFRdna0@141 | 443403243
capture.kernel_drops | RxPFRdna0@141 | 0
capture.kernel_packets | RxPFRdna0@151 | 432499371
capture.kernel_drops | RxPFRdna0@151 | 0
一些
****** HTOP

在PF_RING源代码的例子目录中 -
/ pfring - svn的 - 最新/用户级/例子
你有一些工具可以用来查看数据包的统计信息,例如:
root@suricata:/home/pevman/pfring-svn-latest/userland/examples#
./pfcount_multichannel -i dna0
Capturing from dna0
Found 16 channels
Using PF_RING v.5.6.2
=========================
Absolute Stats: [channel=0][280911 pkts rcvd][0 pkts dropped]
Total Pkts=280911/Dropped=0.0 %
280911 pkts – 238246030 bytes [140327.9 pkt/sec – 952.12 Mbit/sec]
=========================
Actual Stats: [channel=0][99895 pkts][1001.8 ms][99715.9 pkt/sec]
=========================
Absolute Stats: [channel=1][271128 pkts rcvd][0 pkts dropped]
Total Pkts=271128/Dropped=0.0 %
271128 pkts – 220184576 bytes [135440.8 pkt/sec – 879.94 Mbit/sec]
=========================
Actual Stats: [channel=1][91540 pkts][1001.8 ms][91375.9 pkt/sec]
=========================
Absolute Stats: [channel=2][251004 pkts rcvd][0 pkts dropped]
Total Pkts=251004/Dropped=0.0 %
251090 pkts – 210457632 bytes [125430.9 pkt/sec – 840.91 Mbit/sec]
=========================
Actual Stats: [channel=2][85799 pkts][1001.8 ms][85645.2 pkt/sec]
=========================
Absolute Stats: [channel=3][256648 pkts rcvd][0 pkts dropped]
Total Pkts=256648/Dropped=0.0 %
256648 pkts – 213116218 bytes [128207.4 pkt/sec – 851.69 Mbit/sec]
=========================
Actual Stats: [channel=3][86188 pkts][1001.8 ms][86033.5 pkt/sec]
=========================
Absolute Stats: [channel=4][261802 pkts rcvd][0 pkts dropped]
Total Pkts=261802/Dropped=0.0 %
261802 pkts – 225272589 bytes [130782.1 pkt/sec – 900.27 Mbit/sec]
=========================
Actual Stats: [channel=4][86528 pkts][1001.8 ms][86372.9 pkt/sec]
=========================
Absolute Stats: [channel=5][275665 pkts rcvd][0 pkts dropped]
Total Pkts=275665/Dropped=0.0 %
275665 pkts – 239259529 bytes [137707.3 pkt/sec – 956.17 Mbit/sec]
=========================
Actual Stats: [channel=5][91780 pkts][1001.8 ms][91615.5 pkt/sec]
=========================
Absolute Stats: [channel=6][295611 pkts rcvd][0 pkts dropped]
Total Pkts=295611/Dropped=0.0 %
295611 pkts – 231543496 bytes [147671.2 pkt/sec – 925.33 Mbit/sec]
=========================
Actual Stats: [channel=6][100521 pkts][1001.8 ms][100340.8 pkt/sec]
=========================
Absolute Stats: [channel=7][268374 pkts rcvd][0 pkts dropped]
Total Pkts=268374/Dropped=0.0 %
268374 pkts – 230010930 bytes [134065.1 pkt/sec – 919.21 Mbit/sec]
=========================
Actual Stats: [channel=7][91749 pkts][1001.8 ms][91584.5 pkt/sec]
=========================
Absolute Stats: [channel=8][312726 pkts rcvd][0 pkts dropped]
Total Pkts=312726/Dropped=0.0 %
312726 pkts – 286419690 bytes [156220.9 pkt/sec – 1144.64 Mbit/sec]
=========================
Actual Stats: [channel=8][86361 pkts][1001.8 ms][86206.2 pkt/sec]
=========================
Absolute Stats: [channel=9][275091 pkts rcvd][0 pkts dropped]
Total Pkts=275091/Dropped=0.0 %
275091 pkts – 229807313 bytes [137420.5 pkt/sec – 918.39 Mbit/sec]
=========================
Actual Stats: [channel=9][91118 pkts][1001.8 ms][90954.6 pkt/sec]
=========================
Absolute Stats: [channel=10][289441 pkts rcvd][0 pkts dropped]
Total Pkts=289441/Dropped=0.0 %
289441 pkts – 254843198 bytes [144589.0 pkt/sec – 1018.45 Mbit/sec]
=========================
Actual Stats: [channel=10][95537 pkts][1001.8 ms][95365.7 pkt/sec]
=========================
Absolute Stats: [channel=11][241318 pkts rcvd][0 pkts dropped]
Total Pkts=241318/Dropped=0.0 %
241318 pkts – 200442927 bytes [120549.4 pkt/sec – 801.04 Mbit/sec]
=========================
Actual Stats: [channel=11][82011 pkts][1001.8 ms][81864.0 pkt/sec]
=========================
Absolute Stats: [channel=12][300209 pkts rcvd][0 pkts dropped]
Total Pkts=300209/Dropped=0.0 %
300209 pkts – 261259342 bytes [149968.1 pkt/sec – 1044.09 Mbit/sec]
=========================
Actual Stats: [channel=12][101524 pkts][1001.8 ms][101342.0 pkt/sec]
=========================
Absolute Stats: [channel=13][293733 pkts rcvd][0 pkts dropped]
Total Pkts=293733/Dropped=0.0 %
293733 pkts – 259477621 bytes [146733.0 pkt/sec – 1036.97 Mbit/sec]
=========================
Actual Stats: [channel=13][97021 pkts][1001.8 ms][96847.1 pkt/sec]
=========================
Absolute Stats: [channel=14][267101 pkts rcvd][0 pkts dropped]
Total Pkts=267101/Dropped=0.0 %
267101 pkts – 226064969 bytes [133429.1 pkt/sec – 903.44 Mbit/sec]
=========================
Actual Stats: [channel=14][86862 pkts][1001.8 ms][86706.3 pkt/sec]
=========================
Absolute Stats: [channel=15][266323 pkts rcvd][0 pkts dropped]
Total Pkts=266323/Dropped=0.0 %
266323 pkts – 232926529 bytes [133040.5 pkt/sec – 930.86 Mbit/sec]
=========================
Actual Stats: [channel=15][91437 pkts][1001.8 ms][91273.1 pkt/sec]
=========================
Aggregate stats (all channels): [1463243.0 pkt/sec][15023.51 Mbit/sec][0 pkts dropped]
=========================