最简单确认数据分布的方式是检查数据本身,两种相对不同的汇总:summary和fivenum以及通过图像呈现 a display of the numbers bystem(a “stem and leaf” plot)
> attach(faithful)
> summary(eruptions)
Min. 1st Qu. Median Mean 3rd Qu. Max.
1.600 2.163 4.000 3.488 4.454 5.100
> fivenum(eruptions)
[1] 1.6000 2.1585 4.0000 4.4585 5.1000
> stem(eruptions)
The decimal point is 1 digit(s) to the left of the |
16 | 070355555588
18 | 000022233333335577777777888822335777888
20 | 00002223378800035778
22 | 0002335578023578
24 | 00228
26 | 23
28 | 080
30 | 7
32 | 2337
34 | 250077
36 | 0000823577
38 | 2333335582225577
40 | 0000003357788888002233555577778
42 | 03335555778800233333555577778
44 | 02222335557780000000023333357778888
46 | 0000233357700000023578
48 | 00000022335800333
50 | 0370
直方图:
> hist(eruptions)
##x轴分箱变小,画出密度曲线
> hist(eruptions, seq(1.6, 5.2, 0.2), prob=TRUE
我们能够画出数据集的积累分布图,通过使用函数ecdf.
> plot(ecdf(eruptions), do.points=FALSE, verticals=TRUE)
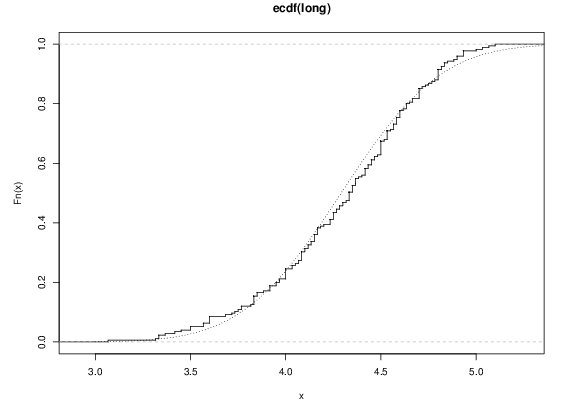
调整分布情况
> long <- eruptions[eruptions > 3]
> plot(ecdf(long), do.points=FALSE, verticals=TRUE)
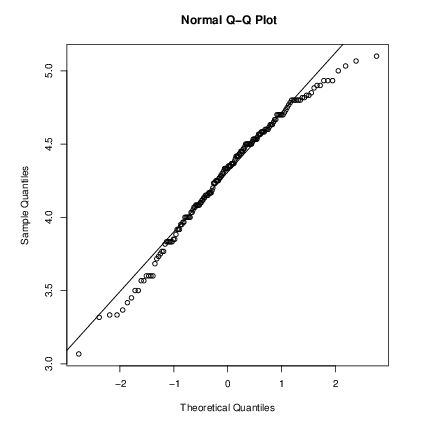
Quantile-quantile (Q-Q) plots QQ图可以帮助我们更为精细的呈现.
> qqnorm(long); qqline(long)
> qqplot(qt(ppoints(250), df = 5), long, xlab = "Q-Q plot for t dsn")#更改标题
>shapiro.test(long)#检验
Shapiro-Wilk normality test
data: long
W = 0.9793, p-value = 0.01052
and the Kolmogorov-Smirnov test
> ks.test(long, "pnorm", mean = mean(long), sd = sqrt(var(long)))
One-sample Kolmogorov-Smirnov test
data: long
D = 0.0661, p-value = 0.4284
alternative hypothesis: two.sided

