Finding differentially expressed features
> # find all markers of cluster 1
> cluster1.markers <- FindMarkers(pbmc, ident.1 = 1, min.pct = 0.25)
   |++++++++++++++++++++++++++++++++++++++++++++++++++| 100% elapsed = 18s

> # find all markers distinguishing cluster 5 from clusters 0 and 3
> cluster5.markers <- FindMarkers(pbmc, ident.1 = 5, ident.2 = c(0, 3), min.pct = 0.25)
   |++++++++++++++++++++++++++++++++++++++++++++++++++| 100% elapsed = 13s
> head(cluster5.markers, n = 5)
                      p_val avg_logFC pct.1 pct.2     p_val_adj
FCGR3A        8.331882e-208  2.954044 0.975 0.040 1.142634e-203
CFD           1.932644e-198  2.373241 0.938 0.036 2.650429e-194
IFITM3        2.710023e-198  2.686679 0.975 0.049 3.716525e-194
CD68          1.069778e-193  2.088907 0.926 0.035 1.467094e-189
RP11-290F20.3 4.218926e-190  1.886957 0.840 0.016 5.785835e-186
- find markers for every cluster compared to all remaining cells, report only the positive ones
pbmc.markers <- FindAllMarkers(pbmc, only.pos = TRUE, min.pct = 0.25, logfc.threshold = 0.25)
pbmc.markers %>% group_by(cluster) %>% top_n(n = 2, wt = avg_logFC)
cluster1.markers <- FindMarkers(pbmc, ident.1 = 1, logfc.threshold = 0.25, test.use = "roc", only.pos = TRUE)
 visualizing marker expression
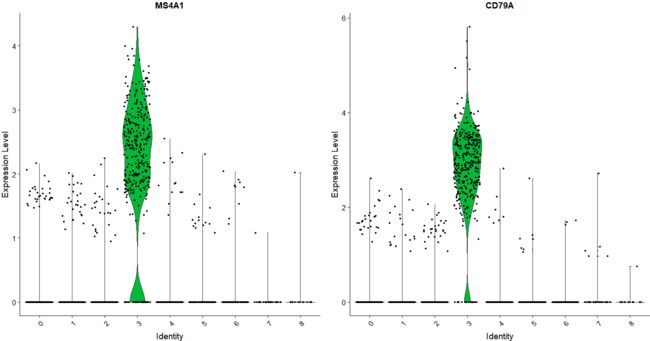
VlnPlot(pbmc, features = c("MS4A1", "CD79A"))
# you can plot raw counts as well
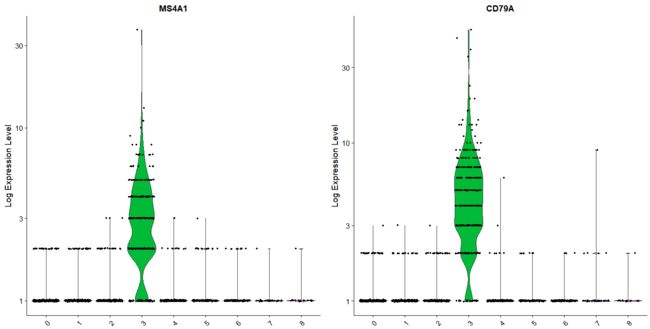
VlnPlot(pbmc, features = c("NKG7", "PF4"), slot = "counts", log = TRUE)
- FeaturePlot (visualizes feature expression on a tSNE or PCA plot) are our most commonly used visualizations
p1=FeaturePlot(pbmc, features = c("MS4A1", "GNLY", "CD3E", "CD14", "FCER1A", "FCGR3A", "LYZ", "PPBP",
                               "CD8A"),reduction = 'tsne')
p2=FeaturePlot(pbmc, features = c("MS4A1", "GNLY", "CD3E", "CD14", "FCER1A", "FCGR3A", "LYZ", "PPBP",
                               "CD8A"),reduction = 'umap')
p3=FeaturePlot(pbmc, features = c("MS4A1", "GNLY", "CD3E", "CD14", "FCER1A", "FCGR3A", "LYZ", "PPBP",
                               "CD8A"),reduction = 'pca')

library(gridExtra)
grid.arrange(p1,p2,p3,ncol = 3, nrow = 1)
- DoHeatmap generates an expression heatmap for given cells and features
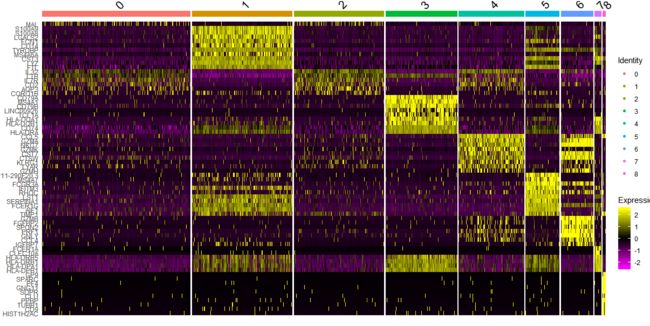
top10 <- pbmc.markers %>% group_by(cluster) %>% top_n(n = 10, wt = avg_logFC)
DoHeatmap(pbmc, features = top10$gene) + NoLegend()

DoHeatmap(pbmc, features = top10$gene)
cc.genes

pbmc <- CellCycleScoring(
  object = pbmc,
  g2m.features = cc.genes$g2m.genes,
  s.features = cc.genes$s.genes
)
head([email protected])[,c(7,8,9,10)] # 我是为了好看取了几列来看,你大可不必。

VlnPlot(pbmc, features = c("nFeature_RNA", "nCount_RNA", "percent.mt","percent.HB","G2M.Score","S.Score"), ncol = 6)

# 在UMAP空间中绘制细胞周期信息

umapem<- pbmc@[email protected]
umapem<-as.data.frame(umapem)
metada= [email protected]
dim(umapem);dim(metada)

metada$bar<-rownames(metada)
umapem$bar<-rownames(umapem)
ccdata<-merge(umapem,metada,by="bar")
head(ccdata)
library(ggplot2)
plot<-ggplot(ccdata, aes(UMAP_1, UMAP_2,label=Phase))+geom_point(aes(colour = factor(Phase)))+
  #plot<-plot+scale_colour_manual(values=c("#CC33FF","Peru","#660000","#660099","#990033","black","red", "#666600", "green","#6699CC","#339900","#0000FF","#FFFF00","#808080"))+
  labs("@yunlai",x = "", y="")
plot=plot+scale_color_aaas()  +
  theme_bw()+theme(panel.grid=element_blank(),legend.title=element_blank(),legend.text = element_text(color="black", size = 10, face = "bold"))
plot<-plot+guides(colour = guide_legend(override.aes = list(size=5))) +theme(plot.title = element_text(hjust = 0.5))

plot
- Assigning cell type identity to clusters --------------------------------
#Assigning cell type identity to clusters
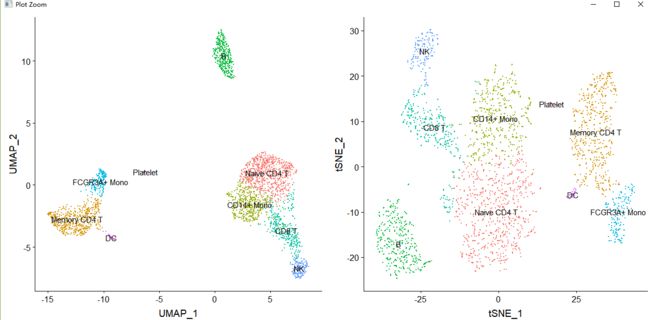
new.cluster.ids <- c("Naive CD4 T", "Memory CD4 T", "CD14+ Mono", "B", "CD8 T", "FCGR3A+ Mono",
                     "NK", "DC", "Platelet")
names(new.cluster.ids) <- levels(pbmc)
pbmc <- RenameIdents(pbmc, new.cluster.ids)
plot1<-DimPlot(pbmc, reduction = "umap", label = TRUE, pt.size = 0.5) + NoLegend()
plot2<-DimPlot(pbmc, reduction = "tsne", label = TRUE, pt.size = 0.5) + NoLegend()
grid.arrange(plot1,plot2,ncol = 2, nrow = 1)
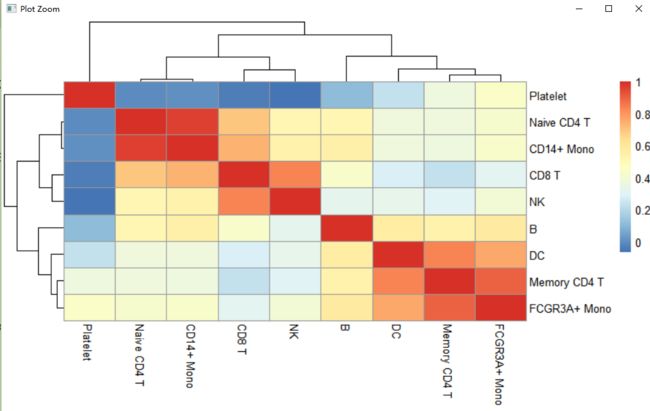
AverageExp<-AverageExpression(pbmc,features=unique(top10$gene))

typeof(AverageExp)
head(AverageExp$RNA)

library(psych)
library(pheatmap)
coorda<-corr.test(AverageExp$RNA,AverageExp$RNA,method="spearman")
pheatmap(coorda$r)

