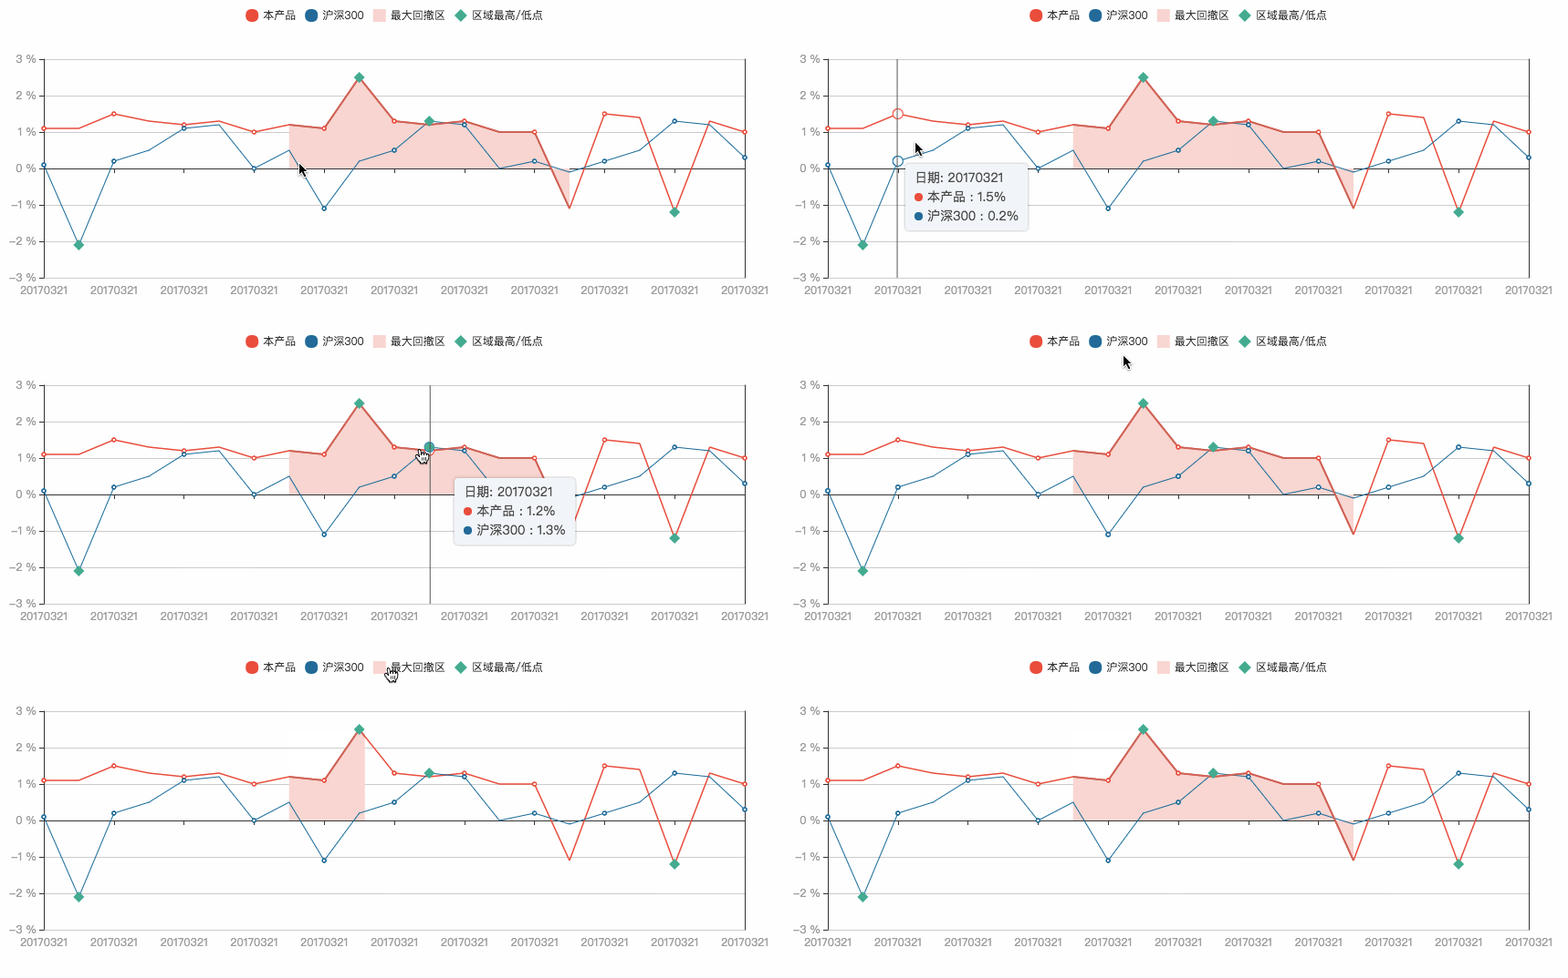
这两天试了试百度的ECharts,不得不说,功能确实强大,下面是由ECharts实现的一个基金走势图的demo.
为了实现想要的效果,做了很多细节上的调整.
option代码如下:
var option = {
        tooltip: {
            backgroundColor:"#f2f6fa",
            trigger: 'axis',
            formatter: function(params){
                var param0 = params[0];
                var param1 = params[1];
                return "日期: "+param0.name+"
"+param0.seriesName+" : "+param0.value+"%
"+param1.seriesName+" : "+param1.value+"%";
            },
            textStyle:{
                color:"#4a4a4a"
            },
            padding: [5, 10],
            extraCssText: 'box-shadow: 0 0 5px rgba(0, 0, 0, 0.3);'
        },
        legend: {
            itemWidth:14,
            data: [{
                name: '本产品',
                icon: 'circle'
            },
                {
                    name: '沪深300',
                    icon: 'circle'
                },
                {
                    name: '最大回撤区',
                    icon: 'rect'
                },
                {
                    name: '区域最高/低点',
                    icon: 'diamond'
                }
            ]
        },
        grid:{
            show:false
        },
        xAxis:  {
            type: 'category',
            boundaryGap: false,
            data: ['20170321','20170321','20170321','20170321','20170321','20170321','20170321',
                '20170321','20170321','20170321','20170321','20170321','20170321','20170321',
                '20170321','20170321','20170321','20170321','20170321','20170321','20170321'
            ],
            axisLabel: {
                textStyle: {
                    color: "#9d9d9d"
                }
            }

        },
        yAxis: [
            {
                type: 'value',
                axisLabel: {
                    formatter: '{value} %',
                    textStyle: {
                        color: "#9d9d9d"
                    }
                }
            },
            {
                type: 'value'
            }
        ],

        series: [
            {
                name:'本产品',
                type:'line',
                data:[1.1, 1.1, 1.5, 1.3, 1.2, 1.3, 1.0,
                    1.2, 1.1, 2.5, 1.3, 1.2, 1.3, 1.0,
                    1.0, -1.1, 1.5, 1.4, -1.2, 1.3, 1.0],
                lineStyle: {
                    normal: {
                        color: "#F44E42",
                        width: 1.5

                    }
                },
                itemStyle: {
                    normal: {
                        color: "#F44E42",
                        borderWidth: 1,
                        borderType: 'solid'
                    }
                },
                markPoint: {
                    symbol:"diamond",
                    symbolSize:12,
                    label: {
                        normal: {
                            show:false
                        }
                    },
                    itemStyle: {
                        normal: {
                            color: "#29AB91"
                        }
                    },
                    data: [
                        {type: 'max', name: '最高点'},
                        {type: 'min', name: '最低点'}
                    ]
                }
            },
            {
                name:'沪深300',
                type:'line',
                data:[0.1, -2.1, 0.2, 0.5, 1.1, 1.2, 0,
                    0.5, -1.1, 0.2, 0.5, 1.3, 1.2, 0,
                    0.2, -0.1, 0.2, 0.5, 1.3, 1.2, 0.3],
                lineStyle: {
                    normal: {
                        color: "#026996",
                        width: 1
                    }
                },
                itemStyle: {
                    normal: {
                        color: "#026996",
                        borderWidth: 1,
                        borderType: 'solid'
                    }
                },
                markPoint: {
                    symbol:"diamond",
                    symbolSize:12,
                    label: {
                        normal: {
                            show:false
                        }
                    },
                    itemStyle: {
                        normal: {
                            color: "#29AB91"
                        }
                    },
                    data: [
                        {type: 'max', name: '最高点'},
                        {type: 'min', name: '最低点'}
                    ]
                }
            },
            {
                name:'最大回撤区',
                type:'line',
                data:[null, null, null, null,null,null, null,
                    1.2, 1.1, 2.5, 1.3, 1.2, 1.3, 1.0,1.0, -1.1
                ],
                lineStyle: {
                    normal: {
                        color: "#D7635A"
                    }
                },
                itemStyle: {
                    normal: {
                        opacity:0,
                        color: "#FCD6D2"
                    }
                },
                areaStyle: {
                    normal: {
                        color: "#FCD6D2",
                        opacity: 1
                    }
                }
            },
            {
                name:'区域最高/低点',
                type:'line',
                data:[
                ],
                lineStyle: {
                    normal: {
                        color: "#29AB91"
                    }
                },
                itemStyle: {
                    normal: {
                        opacity:0,
                        color: "#29AB91"
                    }
                }
            }
        ]
    };
