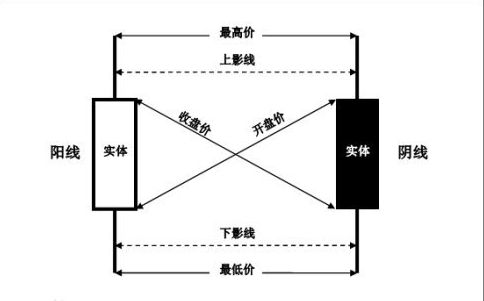
K线图需要引入的类:QCPFinancial,首先来看下K线图的示意图:
其中阳线在中国一般使用红色表示,阴线使用绿色表示
K线图的数据结构
QCPFinancialData是QCPFinancial所使用的数据结构,包含五个数据类型,如下所示:
| 数据 | 含义 |
|---|---|
| key | key轴坐标 |
| open | 开盘 |
| close | 关盘 |
| low | 最低 |
| high | 最高 |
K线图的风格
| 函数 | 含义 |
|---|---|
| setChartStyle | csOhlc(美国线) csCandlestick(蜡烛图) |
| setWidth | wtAbsolute(像素) wtAxisRectRatio(轴矩形比例) wtPlotCoords(坐标轴,默认) |
| setTwoColored | 是否显示两种颜色,即阳线和阴线可以有各自的颜色 |
| setBrushPositive | 阳线画刷 |
| setBrushNegative | 阴线画刷 |
| setPenPositive | 阳线画笔 |
| setPenNegative | 阴线画笔 |
timeSeriesToOhlc函数
如果数据仅有一系列值(例如价格与时间)可用,则可以使用静态函数timeSeriesToOhlc生成合并的OHLC数据,然后将其传递给setData函数
| 参数 | 含义 |
|---|---|
| time | 时间 |
| value | 值 |
| timeBinSize | 时间间隔大小,一般是一天(3600*24) |
| timeBinOffset | 时间起始,一般传入time[0] |
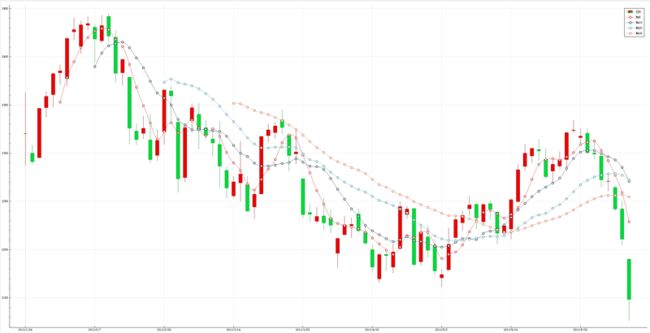
完整示例
来源:echarts
class MyAxisTickerText : public QCPAxisTickerText
{
protected:
    virtual QVector createTickVector(double tickStep, const QCPRange &range) Q_DECL_OVERRIDE
    {
        Q_UNUSED(tickStep)
        QVector result;
        if (mTicks.isEmpty())
            return result;

        auto start = mTicks.lowerBound(range.lower);
        auto end = mTicks.upperBound(range.upper);
        if (start != mTicks.constBegin()) --start;
        if (end != mTicks.constEnd()) ++end;

        int count = cleanMantissa(std::distance(start, end) / double(mTickCount + 1e-10));

        auto it = start;
        while (it != end) {
            result.append(it.key());
            int step = count;
            if (step == 0) ++it;
            while (--step >= 0 && it != end)
                ++it;
        }

        return result;
    }
};

void MainWindow::setupShangHaiIndexDemo(QCustomPlot *customPlot)
{
    const QColor BrushPositive("#ec0000");
    const QColor PenPositive("#8a0000");
    const QColor BrushNegative("#00da3c");
    const QColor PenNegative("#008f28");

    const QVector rawTimes = {
        "2013/1/24", "2013/1/25", "2013/1/28", "2013/1/29", "2013/1/30", "2013/1/31", "2013/2/1", "2013/2/4", "2013/2/5",  "2013/2/6", "2013/2/7",
        "2013/2/8",  "2013/2/18", "2013/2/19", "2013/2/20", "2013/2/21", "2013/2/22", "2013/2/25", "2013/2/26", "2013/2/27", "2013/2/28", "2013/3/1",
        "2013/3/4",  "2013/3/5",  "2013/3/6",  "2013/3/7", "2013/3/8",  "2013/3/11", "2013/3/12", "2013/3/13", "2013/3/14", "2013/3/15", "2013/3/18",
        "2013/3/19", "2013/3/20", "2013/3/21", "2013/3/22", "2013/3/25", "2013/3/26", "2013/3/27", "2013/3/28", "2013/3/29", "2013/4/1", "2013/4/2",
        "2013/4/3",  "2013/4/8",  "2013/4/9",  "2013/4/10", "2013/4/11", "2013/4/12", "2013/4/15", "2013/4/16", "2013/4/17", "2013/4/18", "2013/4/19",
        "2013/4/22", "2013/4/23", "2013/4/24", "2013/4/25", "2013/4/26", "2013/5/2",  "2013/5/3",  "2013/5/6",  "2013/5/7",  "2013/5/8",  "2013/5/9",
        "2013/5/10", "2013/5/13", "2013/5/14", "2013/5/15", "2013/5/16", "2013/5/17", "2013/5/20", "2013/5/21", "2013/5/22", "2013/5/23", "2013/5/24",
        "2013/5/27", "2013/5/28", "2013/5/29", "2013/5/30", "2013/5/31", "2013/6/3",  "2013/6/4",  "2013/6/5",  "2013/6/6",  "2013/6/7",  "2013/6/13",
    };
    // 数据意义:开盘(open),收盘(close),最低(lowest),最高(highest)
    const QVector> rawDatas = {
        { 2320.26,2320.26,2287.3,2362.94}, { 2300,2291.3,2288.26,2308.38}, { 2295.35,2346.5,2295.35,2346.92}, { 2347.22,2358.98,2337.35,2363.8},
        { 2360.75,2382.48,2347.89,2383.76}, { 2383.43,2385.42,2371.23,2391.82}, {2377.41,2419.02,2369.57,2421.15}, {2425.92,2428.15,2417.58,2440.38},
        {2411,2433.13,2403.3,2437.42}, {2432.68,2434.48,2427.7,2441.73}, {2430.69,2418.53,2394.22,2433.89}, {2416.62,2432.4,2414.4,2443.03},
        { 2441.91,2421.56,2415.43,2444.8}, { 2420.26,2382.91,2373.53,2427.07}, { 2383.49,2397.18,2370.61,2397.94}, { 2378.82,2325.95,2309.17,2378.82},
        { 2322.94,2314.16,2308.76,2330.88}, { 2320.62,2325.82,2315.01,2338.78}, { 2313.74,2293.34,2289.89,2340.71}, { 2297.77,2313.22,2292.03,2324.63},
        { 2322.32,2365.59,2308.92,2366.16}, {2364.54,2359.51,2330.86,2369.65}, {2332.08,2273.4,2259.25,2333.54}, {2274.81,2326.31,2270.1,2328.14},
        {2333.61,2347.18,2321.6,2351.44}, {2340.44,2324.29,2304.27,2352.02}, {2326.42,2318.61,2314.59,2333.67}, { 2314.68,2310.59,2296.58,2320.96},
        { 2309.16,2286.6,2264.83,2333.29}, { 2282.17,2263.97,2253.25,2286.33}, { 2255.77,2270.28,2253.31,2276.22}, { 2269.31,2278.4,2250,2312.08},
        { 2267.29,2240.02,2239.21,2276.05}, { 2244.26,2257.43,2232.02,2261.31}, { 2257.74,2317.37,2257.42,2317.86}, { 2318.21,2324.24,2311.6,2330.81},
        { 2321.4,2328.28,2314.97,2332}, { 2334.74,2326.72,2319.91,2344.89}, { 2318.58,2297.67,2281.12,2319.99}, { 2299.38,2301.26,2289,2323.48},
        { 2273.55,2236.3,2232.91,2273.55}, { 2238.49,2236.62,2228.81,2246.87}, {2229.46,2234.4,2227.31,2243.95}, {2234.9,2227.74,2220.44,2253.42},
        {2232.69,2225.29,2217.25,2241.34}, {2196.24,2211.59,2180.67,2212.59}, {2215.47,2225.77,2215.47,2234.73}, { 2224.93,2226.13,2212.56,2233.04},
        { 2236.98,2219.55,2217.26,2242.48}, { 2218.09,2206.78,2204.44,2226.26}, { 2199.91,2181.94,2177.39,2204.99}, { 2169.63,2194.85,2165.78,2196.43},
        { 2195.03,2193.8,2178.47,2197.51}, { 2181.82,2197.6,2175.44,2206.03}, { 2201.12,2244.64,2200.58,2250.11}, { 2236.4,2242.17,2232.26,2245.12},
        { 2242.62,2184.54,2182.81,2242.62}, { 2187.35,2218.32,2184.11,2226.12}, { 2213.19,2199.31,2191.85,2224.63}, { 2203.89,2177.91,2173.86,2210.58},
        {2170.78,2174.12,2161.14,2179.65}, {2179.05,2205.5,2179.05,2222.81}, {2212.5,2231.17,2212.5,2236.07}, {2227.86,2235.57,2219.44,2240.26},
        {2242.39,2246.3,2235.42,2255.21}, {2246.96,2232.97,2221.38,2247.86}, { 2228.82,2246.83,2225.81,2247.67},  { 2247.68,2241.92,2231.36,2250.85},
        { 2238.9,2217.01,2205.87,2239.93}, { 2217.09,2224.8,2213.58,2225.19}, { 2221.34,2251.81,2210.77,2252.87}, { 2249.81,2282.87,2248.41,2288.09},
        { 2286.33,2299.99,2281.9,2309.39},  { 2297.11,2305.11,2290.12,2305.3},  { 2303.75,2302.4,2292.43,2314.18}, { 2293.81,2275.67,2274.1,2304.95},
        { 2281.45,2288.53,2270.25,2292.59}, { 2286.66,2293.08,2283.94,2301.7}, { 2293.4,2321.32,2281.47,2322.1}, { 2323.54,2324.02,2321.17,2334.33},
        { 2316.25,2317.75,2310.49,2325.72}, { 2320.74,2300.59,2299.37,2325.53}, {2300.21,2299.25,2294.11,2313.43}, {2297.1,2272.42,2264.76,2297.1},
        {2270.71,2270.93,2260.87,2276.86}, {2264.43,2242.11,2240.07,2266.69}, {2242.26,2210.9,2205.07,2250.63}, { 2190.1,2148.35,2126.22,2190.1}
    };

    QSharedPointer textTicker(new MyAxisTickerText);     // 文字轴
    textTicker->setTickCount(10);
    QCPDataContainer datas;
    QVector timeDatas, MA5Datas, MA10Datas, MA20Datas, MA30Datas;

    MA5Datas = calculateMA(rawDatas, 5);
    MA10Datas = calculateMA(rawDatas, 10);
    MA20Datas = calculateMA(rawDatas, 20);
    MA30Datas = calculateMA(rawDatas, 30);

    for (int i = 0; i < rawTimes.size(); ++i) {
        timeDatas.append(i);

        QCPFinancialData data;
        data.key = i;
        data.open = rawDatas.at(i).at(0);
        data.close = rawDatas.at(i).at(1);
        data.low = rawDatas.at(i).at(2);
        data.high = rawDatas.at(i).at(3);
        datas.add(data);

        textTicker->addTick(i, rawTimes.at(i));
    }


    QCPFinancial *financial = new QCPFinancial(customPlot->xAxis, customPlot->yAxis);
    financial->setName("日K");
    financial->setBrushPositive(BrushPositive);
    financial->setPenPositive(PenPositive);
    financial->setBrushNegative(BrushNegative);
    financial->setPenNegative(PenNegative);
    financial->data()->set(datas);

    const QVector ColorOptions = {
        "#c23531", "#2f4554", "#61a0a8", "#d48265"
    };

    QCPGraph *graph = customPlot->addGraph();
    graph->setName("MA5");
    graph->setData(timeDatas, MA5Datas);
    graph->setPen(ColorOptions.at(0));
    graph->setScatterStyle(QCPScatterStyle(QCPScatterStyle::ssCircle, QPen(ColorOptions.at(0), 2), QBrush(Qt::white), 8));
    graph->setSmooth(true);

    graph = customPlot->addGraph();
    graph->setName("MA10");
    graph->setData(timeDatas, MA10Datas);
    graph->setPen(ColorOptions.at(1));
    graph->setScatterStyle(QCPScatterStyle(QCPScatterStyle::ssCircle, QPen(ColorOptions.at(1), 2), QBrush(Qt::white), 8));
    graph->setSmooth(true);

    graph = customPlot->addGraph();
    graph->setName("MA20");
    graph->setData(timeDatas, MA20Datas);
    graph->setPen(ColorOptions.at(2));
    graph->setScatterStyle(QCPScatterStyle(QCPScatterStyle::ssCircle, QPen(ColorOptions.at(2), 2), QBrush(Qt::white), 8));
    graph->setSmooth(true);

    graph = customPlot->addGraph();
    graph->setName("MA30");
    graph->setData(timeDatas, MA30Datas);
    graph->setPen(ColorOptions.at(3));
    graph->setScatterStyle(QCPScatterStyle(QCPScatterStyle::ssCircle, QPen(ColorOptions.at(3), 2), QBrush(Qt::white), 8));
    graph->setSmooth(true);

    customPlot->xAxis->setTicker(textTicker);
    customPlot->rescaleAxes();
    customPlot->xAxis->scaleRange(1.05, customPlot->xAxis->range().center());
    customPlot->yAxis->scaleRange(1.05, customPlot->yAxis->range().center());
    customPlot->legend->setVisible(true);
}

QVector MainWindow::calculateMA(const QVector > &v, int dayCount)
{
    auto func = [](double result, const QVector &v2){
      return result + v2[1];
    };

    QVector result;
    for (int i = 0; i < v.size(); ++i) {
        if (i < dayCount) {
            result.append(qQNaN());
        } else {
            double sum = std::accumulate(v.begin() + i - dayCount + 1, v.begin() + i + 1, 0.0, func);
            result.append(sum / dayCount);
        }
    }
    return result;
}
最后
- 不使用
QCPAxisTickerDateTime作为轴标签,是因为数据的日期不是连续的,使用QCPAxisTickerDateTime会导致不连续的部分有间隔,如果需要使用QCPAxisTickerDateTime的话需要设置setTickOrigin为时间的第一个数据,不然的话会发生K线图与坐标轴对应不上的情况,同时还要设置K线图的宽度setWidth,例如一天的宽度financial->setWidth(3600 * 24 * 0.8),乘以0.8是为了稍微缩小一点 - 继承
QCPAxisTickerText的原因是因为QCPAxisTickerText在数据比较多的时候轴标签会挤在一起,密密麻麻的不好看

