新冠肺炎疫情数据爬取以及几种简单的地图可视化方法
众所周知,新冠肺炎疫情是一次很流行的全球性公共卫生事件。如今我国疫情已经好了许多,但世界各国的疫情依然严峻。特殊时期,正好尝试一下疫情网络数据的抓取,并用几种python库对数据进行简单的地图可视化(folium,geopandas,cartopy)。
1. 爬取疫情数据
许多网站都记录了实时的疫情数据,但不是所有的数据都可爬。这里用的是必应的新冠肺炎追踪(https://www.bing.com/covid),理由是(1)它的源代码里有所有详细的数据;(2)从全球到国家到地方都有数据,结构是嵌套的,详细全面可爬;(3)重点,数据居然带经纬度信息!这对地理制图就很友好了。
import urllib.request as req
import bs4
import json

# read source code and scrape data
url = 'https://www.bing.com/covid'
response = req.urlopen(url)
data = response.read().decode('utf-8')

root = bs4.BeautifulSoup(data, "html.parser")
text = root.find(id="main").get_text()
maintext = text[9:-1]
textlist = json.loads(maintext)    # str to list
del url, response, data

# country data
countryData = textlist["areas"]
for country in countryData:
    templist = []
    templist.append(country["id"])
    templist.append(country["displayName"])
    templist.append(country["totalConfirmed"])
    templist.append(country["totalDeaths"])
    templist.append(country["totalRecovered"])
    try:    # some coordinate data is missed
        templist.append(country["long"])
        templist.append(country["lat"])
    except:
        pass
    datalist.append(templist)
    del templist
根据网页源代码,每个地区的数据都存在一个字典里面,字典字段包含id,displayName,areas,totalConfirmed,totalDeaths,totalRecovered,lat,long等等,其中areas里面是该地区内的子区域数据,例如美国加州的数据就在美国字典里的areas里面,所以各级的数据都可以找到。这里就简单爬个全球各国家、地区的确诊,死亡,治愈人数。爬下来之后写进excel,一共有两百多个国家或地区,长这样:
2 可视化
有了这些数据之后开始制图,这里尝试了三种python库:(1)folium;(2)geopandas;(3)cartopy。
(1)folium
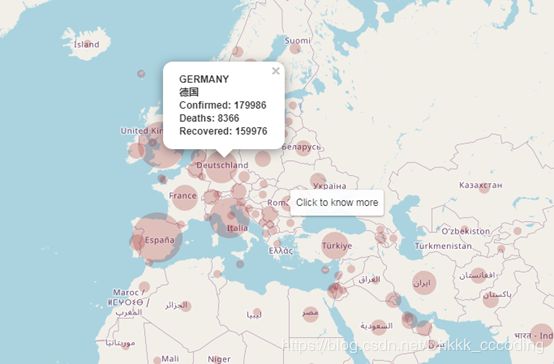
folium能简单地创建一个交互式地图。支持OSM,Mapbox,高德百度等底图,所以各种API也可以放里面使用。因为是交互式的,且地图是显示在网页,所以在jupyter notebook使用比较友好。这里模仿Bing疫情追踪的网站,用圆圈大小代表全球各地的确诊人数,然后点击圆圈能显示人数的详细信息。
# --------------------------------------------------------------------
# Visualization1: folium
# --------------------------------------------------------------------

# init map
map1 = folium.Map(
    location = [43.52902984,12.16218376],
    zoom_start = 2,
    min_zoom = 2,
    max_zoom = 10,
    #tiles = 'Stamen Toner'
    tiles = 'OpenStreetMap'
    )

data = xlrd.open_workbook('C:/Users/user/Desktop/COVID-19-Data.xls')
table = data.sheets()[0]
for i in range(table.nrows-2) :
    templist = table.row_values(i+2)
    # information in popup
    popup = '' + templist[0].upper() + '' + templist[1] + ''
    popup += 'Confirmed: ' + str(int(templist[2]))
    try: popup += 'Deaths: ' + str(int(templist[3]))   # some are none, cant be int()
    except: popup += 'Deaths: ' + str(templist[3])
    try: popup += 'Recovered: ' + str(int(templist[4]))
    except: popup += 'Recovered: ' + str(templist[4])

    # easy function to classify the radius of circle
    radius = classifyRadius(templist[2])

    # add marker
    folium.CircleMarker(
        location = [templist[6], templist[5]],
        popup=folium.Popup(popup,  max_width=200),
        radius = radius,
        tooltip='Click to know more',
        color = 'transparent',
        fill = True,
        fill_color='#8B0000'
    ).add_to(map1)

    del templist, popup, radius

map1.save('C:/Users/user/Desktop/map1.html')
del data, table
print ("finished map1 by folium")
效果如下。特点是很简单的交互式地图,用自带的底图就不用申请什么key,需要多样的内容也可以用其他来源的地图,极其自由多样。marker有很多种类型可以选择,主要在marker的内容里面做文章。
(2)geopandas
geopandas是pandas库的扩展模块,包含两种数据结构,其中GeoSeries相当于地理信息,GeoDataFrame相当于地理信息+属性信息,所以每个GeoDataFrame都包含一个GeoSeries。空间分析功能比较全面,但比较麻烦的是这个库还需要很多其他库的支持:shapely用于地理处理,fiona用于访问文件,dechartes和matplotlib用于制图,为了更丰富的分级显示方法则还需要mapclassify。安装都花了一些时间,具体可参考https://www.hatarilabs.com/ih-en/how-to-install-python-geopandas-on-anaconda-in-windows-tutorial
这里面有自带的世界地图各国的地理数据,刚好可以和爬取的疫情数据相结合。通过疫情数据的地理坐标进行spatial join,就可以把两个数据结合起来,进行可视化。
# --------------------------------------------------------------------
# Visualization2: geopandas
# --------------------------------------------------------------------

# read data and change to geopandas format
data = xlrd.open_workbook('C:/Users/user/Desktop/COVID-19-Data.xls')
table = data.sheets()[0]
datadict = {'country':table.col_values(0)[2:],
            'confirmed':table.col_values(2)[2:],
            'deaths':table.col_values(3)[2:],
            'recovered':table.col_values(4)[2:],
            'longtitude':table.col_values(5)[2:],
            'latitude':table.col_values(6)[2:]}

df = pandas.DataFrame(datadict)
cov19data = geopandas.GeoDataFrame(df, geometry=geopandas.points_from_xy(df.longtitude, df.latitude))

# world data with all country polygon in geopandas-built-in data
world = geopandas.read_file(geopandas.datasets.get_path('naturalearth_lowres'))

# spatial join
world_cov19 = geopandas.sjoin(world, cov19data, how="inner", op='intersects')

fig, ax = plt.subplots(1, 1, figsize=(15,10))
world_cov19.plot(column='confirmed',
                ax=ax,
                cmap='Reds',    # color type
                scheme='NaturalBreaks',    # classify scheme
                k=12,     # number of classify
                legend=True,
                legend_kwds={'loc':'lower left','title':'COV-19 Confirmed Cases'})
plt.show()
print ("finished map2 by geopandas")
效果如下。
(3)cartopy
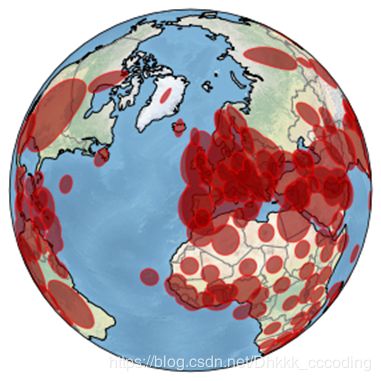
cartopy也是一个能用于空间分析的库,特点是提供了很多种投影定义,可以从不同视角制图,个人认为图的颜值也比较高。值得一提的是,这个库不能像folium一样创建circleMarker,想用圆圈大小表示疫情,只能创建点-创建点的缓冲区。
# --------------------------------------------------------------------
# Visualization3: cartopy
# --------------------------------------------------------------------

def COV19_cartopy():
    # read data and classify
    data = xlrd.open_workbook('C:/Users/user/Desktop/COVID-19-Data.xls')
    table = data.sheets()[0]
    pointList, radiusList = classifyRadius(templist[2], table)

    # create buffer to draw a circle
    def addBuffer2ax(ax, pointList, radiusList):
        for i in range(len(pointList)):
            circles = geometry.MultiPoint(pointList[i]).buffer(radiusList[i])
            cov19data = cfeature.ShapelyFeature([circles], ccrs.PlateCarree())
            ax.add_feature(cov19data, edgecolor='red', facecolor='#8B0000',alpha=0.6)
            del circles, cov19data

    # define layer in cartopy
    fig = plt.figure(figsize=(10, 5))
    ax = fig.add_subplot(1, 1, 1, projection=ccrs.PlateCarree())
    ax.set_global()  # map scope = global
    ax.stock_img()  # Put a background image on for nice sea rendering.

    # add country layer
    country = cfeature.NaturalEarthFeature(
        category='cultural',
        name='admin_0_boundary_lines_land',
        scale='50m',
        facecolor='none')
    ax.add_feature(country, edgecolor='gray')

    # add some feature to make map beautiful
    ax.add_feature(cfeature.LAND)
    ax.add_feature(cfeature.COASTLINE)

    # add circle to present COV-19
    addBuffer2ax(ax,pointList,radiusList)

    plt.show()
效果如下。试了不同的projection,都还行。底图来自该库提供的数据接口,来自(https://www.naturalearthdata.com/),相当于也有自带数据可用。感觉相比于空间分析,cartopy更偏向于不同形式的绘图。
-------------------------------------------------------------------
想尝试这些工具主要是看到知乎的一个回答(https://www.zhihu.com/question/33783546),以后有机会再试试pyecharts,bokeh,plotly等等。
希望疫情赶紧结束 T_T。


