python可视化-plot()函数
函数功能:展现变量的趋势变化。
调用签名:plt.plot(x, y, ls="-", lw=2, label=“plot figure”)
x: x轴上的数值
y: y轴上的数值
ls:折线图的线条风格
lw:折线图的线条宽度
label:标记图内容的标签文本
matplotlib.pyplot
import matplotlib.pyplot as plt
import numpy as np

x = np.linspace(0.05, 10, 1000)
y = np.cos(x)

plt.plot(x, y, ls="-", lw=2, label="plot figure")

plt.legend()

plt.show()

pylab
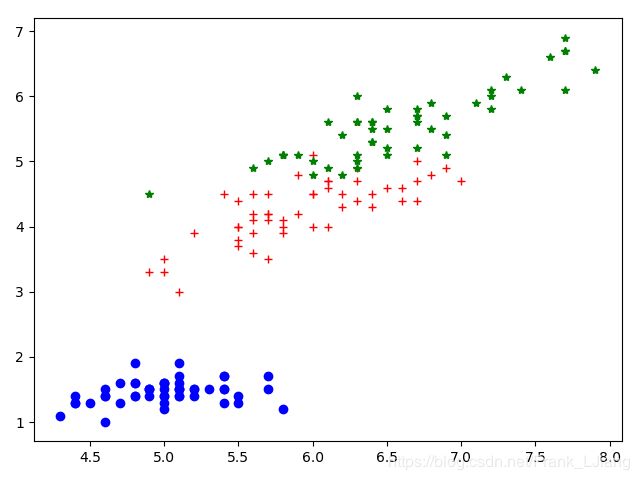
#figure for 2D data
from pylab import plot, show
from sec import *
plot(data[target=='setosa',0],data[target=='setosa',2],'bo')#data来自一个数据集
plot(data[target=='versicolor',0],data[target=='versicolor',2],'r+')
plot(data[target=='virginica',0],data[target=='virginica',2],'g*')
show()
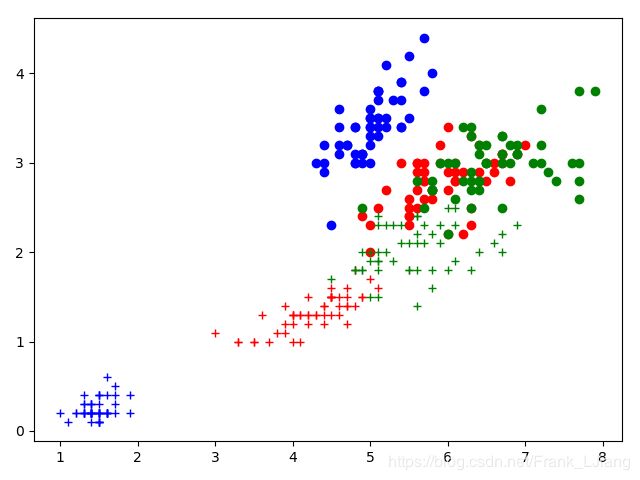
#figure for all 4D(4个维度) data, 同色一类,圈是花萼,加号花瓣
setosa_sepal_x = ssx = data[target == 'setosa', 0]
setosa_sepal_y = ssy = data[target == 'setosa', 1]
setosa_petal_x = spx = data[target == 'setosa', 2]
setosa_petal_y = spy = data[target == 'setosa', 3]
versicolor_sepal_x = vsx = data[target == 'versicolor', 0]
versicolor_sepal_y = vsy = data[target == 'versicolor', 1]
versicolor_petal_x = vpx = data[target == 'versicolor', 2]
versicolor_petal_y = vpy = data[target == 'versicolor', 3]
virginica_sepal_x = vgsx = data[target == 'virginica', 0]
virginica_sepal_y = vgsy = data[target == 'virginica', 1]
virginica_petal_x = vgpx = data[target == 'virginica', 2]
virginica_petal_y = vgpy = data[target == 'virginica', 3]
plot(ssx, ssy, 'bo', spx, spy, 'b+')
plot(vsx, vsy, 'ro', vpx, vpy, 'r+')
plot(vgsx, vgsy, 'go', vgpx, vgpy, 'g+')
show()