原文地址:https://mp.weixin.qq.com/s/xg7cggq45tBI0EQUSxPKFw
8.1 Introduction
第八章讲的是ggplot2的主题设置,通过它你可以对数据之外的图形外观进行控制。第一版的中文版的把这一章的章节名翻译为“精雕细琢”。
控制主题设置主要有以下四个方面:
主题元素,指的是非数据元素,plot.title控制标题的外观,axis.ticks.x控制x轴的刻度,legend.key.height控制图例中按键的高度。
元素函数,描述元素的视觉属性,例如element text()可以设置字体大小、颜色和文本外观如plot.title。
theme()函数,用来覆盖默认的主题元素,如theme(plot.title=element text(colour="red"))
完整主题,如theme_grey(),用来把所有主题元素协调一致。
举例,如下图表,
(变量cty和hwy:城市和高速公路行驶记录每加仑行驶的英里数)
base <- ggplot(mpg, aes(cty, hwy, color = factor(cyl))) +
geom_jitter() +
geom_abline(colour = "grey50", size = 2)
base
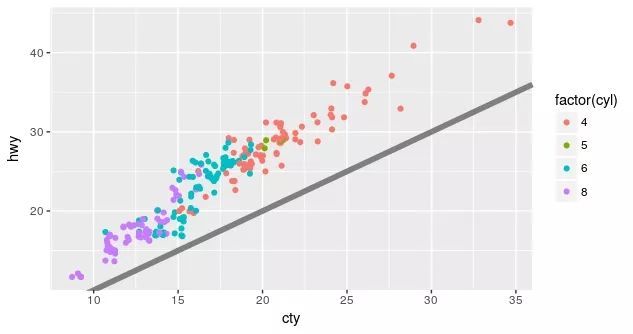
在这个图的基础上,我们想改进轴和图例的标签;添加标题;调整颜色等,
通过第六章标度相关的知识我们可以添加标签、修改标度:
labelled <- base +
labs(
x = "City mileage/gallon",
y = "Highway mileage/gallon",
colour = "Cylinders",
title = "Highway and city mileage are highly correlated"
) +
scale_colour_brewer(type = "seq", palette = "Spectral")
labelled
下一步,如果你想改变整个风格,修改标度就不能满足了,就要用的这一章的内容
如修改背景颜色、图例位置、移除次要网格线、改变字体大小
styled <- labelled +
theme_bw() +
theme(
plot.title = element_text(face = "bold", size = 12),
legend.background = element_rect(fill = "white", size = 4, colour = "white"),
legend.justification = c(0, 1),
legend.position = c(0, 1),
axis.ticks = element_line(colour = "grey70", size = 0.2),
panel.grid.major = element_line(colour = "grey70", size = 0.2),
panel.grid.minor = element_blank()
)
styled
8.2 Complete Themes
ggplot2有多个内置主题。其中默认主题是theme_grey(),淡灰色背景和白色网格线。除此之外还有很多其他主题
theme_bw(): 是theme_grey()的变体,白色背景和灰色网格线
theme_linedraw(): 白色背景黑色线条
theme_light(): 和theme_linedraw()很像,区别是线条为灰色
theme_dark():黑色背景的theme_light(),可以用来画薄彩色线条
theme_minimal():简约主题
theme_classic(): 只有x、y轴没有背景和网格线
theme_void(): 完全空白的主题
创建一个简单的数据集作为例子,分别设置成以上七个主题:
df <- data.frame(x = 1:3, y = 1:3)
base <- ggplot(df, aes(x, y)) + geom_point()
base + theme_grey() + ggtitle("theme_grey()")
base + theme_bw() + ggtitle("theme_bw()")
base + theme_linedraw() + ggtitle("theme_linedraw()")
base + theme_light() + ggtitle("theme_light()")
base + theme_dark() + ggtitle("theme_dark()")
base + theme_minimal() + ggtitle("theme_minimal()")
base + theme_classic() + ggtitle("theme_classic()")
base + theme_void() + ggtitle("theme_void()")
除此之外,有一个专门的主题R包叫ggthemes(Jeffrey Arnold),里面有更多的选择。
8.3 Modifying Theme Components
这一节讲的是如何修改主题中的个别部分,使用相关的元素函数。
基本语法如:
plot + theme(element.name = element function())
元素函数有四种基本类型:字体(text)、线条(line)、矩形(rectangles)和空白(blank)。
element_text():修改图标题的位置和字体,包括family、face、colour、size、hjust、vjust、angle、lineheight这些参数
base <- ggplot(mpg, aes(cty, hwy, color = factor(cyl))) +
geom_jitter() +
geom_abline(colour = "grey50", size = 2)
base_t <- base + labs(title = "This is a ggplot") + xlab(NULL) + ylab(NULL)
base_t + theme(plot.title = element_text(size = 16))
base_t + theme(plot.title = element_text(face = "bold", colour = "red"))
base_t + theme(plot.title = element_text(hjust = 1))
另外,margin()参数可以设置标题和图表之间的距离,默认值是0,左右上下均可设置:
# The margins here look asymmetric because there are also plot margins
base_t + theme(plot.title = element_text(margin = margin()))
base_t + theme(plot.title = element_text(margin = margin(t = 10, b = 10)))
base_t + theme(axis.title.y = element_text(margin = margin(r = 10)))
element_line:修改网格线,颜色、粗细、虚实等,如colour,size以及linetype
base + theme(panel.grid.major = element_line(colour = "black"))
base + theme(panel.grid.major = element_line(size = 2))
base + theme(panel.grid.major = element_line(linetype = "dotted"))
element_rect:添加矩形图层,如fill(修改背景颜色),colour,size以及linetype
base + theme(plot.background = element_rect(fill = "grey80", colour = NA))
base + theme(plot.background = element_rect(colour = "red", size = 2))
base + theme(panel.background = element_rect(fill = "linen"))
element_blank():清空画板
base <- ggplot(mpg, aes(cty, hwy, color = factor(cyl))) +
geom_jitter() +
geom_abline(colour = "grey50", size = 2)
base
last_plot() + theme(panel.grid.minor = element_blank())
last_plot() + theme(panel.grid.major = element_blank())
还有一些相关的细枝末节的设置,小白觉得这些设置相当繁琐,很容易就占用了大量的作图时间,也不是重点,所以在此就先跳过啦。
8.4 控制主题的各种元素
大概有40多个属性可以控制主题。大致分为plot,axis,legend,panel和facet这几大类。
下表总结了一下控制主题的主要元素:

下面从中选几个比较重要的来举几个例子
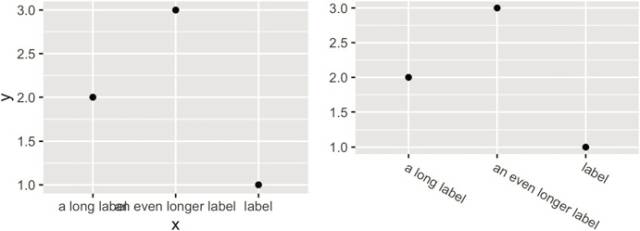
当横轴刻度线标签名字过长,我们可以调整标签的角度和位置:
df <- data.frame(
x = c("label", "a long label", "an even longer label"),
y = 1:3
)
base <- ggplot(df, aes(x, y)) + geom_point()
base
## 调整角度-30°,中心垂直距离下移1
base +
theme(axis.text.x = element_text(angle = -30, vjust = 1, hjust = 0)) +
xlab(NULL) +
ylab(NULL)
假如你需要调整图形的长宽比:
df2 <- data.frame(x = 1:4, y = 1:4, z = rep(c("a", "b"), each = 2))
base <- ggplot(df2, aes(x, y, colour = z)) + geom_point()
base2 <- base + theme(plot.background = element_rect(colour = "grey50"))
# Wide screen
base2 + theme(aspect.ratio = 9 / 16)
# Long and skiny
base2 + theme(aspect.ratio = 2 / 1)
# Square
base2 + theme(aspect.ratio = 1)
8.5 储存和导出(Saving Your Output)
当保存图片时,你有两种基本选择:矢量型图片和栅格型图片
矢量型:图形可以无限缩放没有细节的损失;但如果包含数千个对象,矢量渲染过程会很慢
栅格形:以像素阵列形式存储,有固定的最优观测大小,对于图形印刷,分辨率(600dpi)是较好的方案。
ggplot2有两种保存方法:
第一种:
pdf("output.pdf", width = 6, height = 6)
ggplot(mpg, aes(displ, cty)) + geom_point()
dev.off()
第二种使用ggsave:
ggplot(mpg, aes(displ, cty)) + geom_point()
ggsave("output.pdf")
显然第二种方法更加方便简洁,不过我们需要设置以下参数:
path设定图形储存路径。ggsave()可以生成以下格式:.eps,.pdf,.svg,.wmf,.png,.jpg,.bmp, and.tiff.
width和height设置绝对尺寸的大小,可以精确控制尺寸
分辨率dpi默认值300,你可以修改为600。