基于SVM的图像二分类算法
本实验是用的python代码实现图像的二分类问题,我是在eclipse中搭建python环境。首先需要读入训练数据,代码如下:
X = []
Y = []

for i in range(0, 2):
    #遍历文件夹,读取图片
    for f in os.listdir("G:/Download_Data_bishe/leaf_data/pepper_bellSmall/%s" % i):
        #打开一张图片并灰度化
        Images = cv2.imread("G:/Download_Data_bishe/leaf_data/pepper_bellSmall/%s/%s" % (i, f))
        image=cv2.resize(Images,(256,256),interpolation=cv2.INTER_CUBIC)
        hist = cv2.calcHist([image], [0,1], None, [256,256], [0.0,255.0,0.0,255.0])
        X.append(((hist/255).flatten()))
        Y.append(i)
X = np.array(X)
Y = np.array(Y)
然后调用自动调参函数GridSearchCV(网格搜索)对SVC()中的几个重要参数进行调参,注意,GridSearchCV函数要求的数据集很小,否则调参时间会很长,甚至调不出来,具体代码如下:
#自动调参函数
tuned_parameters = [{'kernel': ['rbf'], 'gamma': [1e-3, 1e-4],
                      'C': [1, 10, 100, 1000]},
                    {'kernel': ['linear'], 'C': [1, 10, 100, 1000]}]
scores = ['precision', 'recall']
for score in scores:
    print("# Tuning hyper-parameters for %s" % score)
    print()

    # 调用 GridSearchCV,将 SVC(), tuned_parameters, cv=5, 还有 scoring 传递进去,
    clf = ms.GridSearchCV(svm.SVC(), tuned_parameters, cv=10,
                       scoring='%s_macro' % score) #cv为迭代次数。#基于交叉验证的网格搜索,cv:确定交叉验证拆分策略。
    # 用训练集训练这个学习器 clf
    clf.fit(X_train, y_train)

    print("Best parameters set found on development set:")
    print()

    # 再调用 clf.best_params_ 就能直接得到最好的参数搭配结果
    print(clf.best_params_)

    print()
    print("Grid scores on development set:")
    print()
    means = clf.cv_results_['mean_test_score']
    stds = clf.cv_results_['std_test_score']

    # 看一下具体的参数间不同数值的组合后得到的分数是多少
    for mean, std, params in zip(means, stds, clf.cv_results_['params']):
        print("%0.3f (+/-%0.03f) for %r"
             % (mean, std * 2, params))

    print()

    print("Detailed classification report:")
    print()
    print("The model is trained on the full development set.")
    print("The scores are computed on the full evaluation set.")
    print()
    y_true, y_pred = y_test, clf.predict(X_test)

    # 打印在测试集上的预测结果与真实值的分数
    print(classification_report(y_true, y_pred))

    print()
以上代码可以得出最优的参数组合,然后就是训练模型了,我用的是sklearn包中封装好的SVC()算法,利用了10折交叉检验和ROC曲线来评价模型,代码如下:
#交叉验证+roc曲线
import matplotlib.pyplot as plt
from sklearn import svm
from sklearn.metrics import roc_curve, auc
from sklearn.model_selection import StratifiedKFold

#交叉验证
cv = StratifiedKFold(n_splits=10)    #导入该模型,后面将数据划分6份
classifier = svm.SVC(kernel='rbf',gamma=0.0001,C=1000, probability=True,random_state=0)   # SVC模型 可以换作AdaBoost模型试试

# 画平均ROC曲线的两个参数
mean_tpr = 0.0              # 用来记录画平均ROC曲线的信息
mean_fpr = np.linspace(0, 1, 100)
cnt = 0
for i, (train, test) in enumerate(cv.split(X,Y)):       #利用模型划分数据集和目标变量 为一一对应的下标
    cnt +=1
    probas_ = classifier.fit(X[train], Y[train]).predict_proba(X[test]) # 训练模型后预测每条样本得到两种结果的概率
    fpr, tpr, thresholds = roc_curve(Y[test], probas_[:, 1])    # 该函数得到伪正例、真正例、阈值,这里只使用前两个

    mean_tpr += np.interp(mean_fpr, fpr, tpr)   # 插值函数 interp(x坐标,每次x增加距离,y坐标)  累计每次循环的总值后面求平均值
    mean_tpr[0] = 0.0           # 将第一个真正例=0 以0为起点

    roc_auc = auc(fpr, tpr)  # 求auc面积
    plt.plot(fpr, tpr, lw=1, label='ROC fold {0:.2f} (area = {1:.2f})'.format(i, roc_auc))    # 画出当前分割数据的ROC曲线

plt.plot([0, 1], [0, 1], '--', color=(0.6, 0.6, 0.6), label='Luck') # 画对角线

mean_tpr /= cnt   # 求数组的平均值
mean_tpr[-1] = 1.0   # 坐标最后一个点为(1,1)  以1为终点
mean_auc = auc(mean_fpr, mean_tpr)

plt.plot(mean_fpr, mean_tpr, 'k--',label='Mean ROC (area = {0:.2f})'.format(mean_auc), lw=2)

plt.xlim([-0.05, 1.05])     # 设置x、y轴的上下限,设置宽一点,以免和边缘重合,可以更好的观察图像的整体
plt.ylim([-0.05, 1.05])
plt.xlabel('False Positive Rate')
plt.ylabel('True Positive Rate')    # 可以使用中文,但需要导入一些库即字体
plt.title('Receiver operating characteristic example')
plt.legend(loc="lower right")
plt.show()
最后,如果想要将训练好的模型保存下来,可以用以下代码:
#保存模型
from sklearn.externals import joblib
os.chdir("G:/Download_Data_bishe/save_model")
joblib.dump(classifier,"train_model.m")
其实我还是很疑惑10折交叉检验到底是用来评价模型的还是用来选择最优模型的???
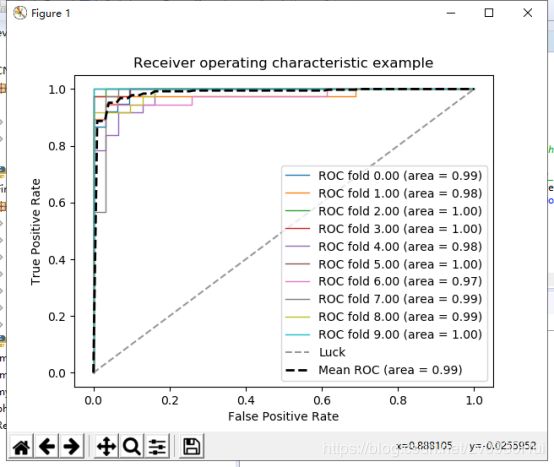
最后,放一张结果图
SVM的识别效果还是可以的,不过也可能我的数据集不大的原因。
完整代码如下:
#SVM算法

import datetime
starttime = datetime.datetime.now()

import numpy as np
import os
import cv2
import sklearn.model_selection as ms
from sklearn.model_selection import train_test_split
from sklearn.metrics import confusion_matrix, classification_report

X = []
Y = []

for i in range(0, 2):
    #遍历文件夹,读取图片
    for f in os.listdir("G:/Download_Data_bishe/leaf_data/pepper_bellSmall/%s" % i):
        #打开一张图片并灰度化
        Images = cv2.imread("G:/Download_Data_bishe/leaf_data/pepper_bellSmall/%s/%s" % (i, f))
        image=cv2.resize(Images,(256,256),interpolation=cv2.INTER_CUBIC)
        hist = cv2.calcHist([image], [0,1], None, [256,256], [0.0,255.0,0.0,255.0])
        X.append(((hist/255).flatten()))
        Y.append(i)
X = np.array(X)
Y = np.array(Y)

#切分训练集和测试集
#X_train, X_test, y_train, y_test = train_test_split(X, Y, test_size=0.3, random_state=1)
#随机率为100%选取其中的30%作为测试集

#交叉验证+roc曲线
import matplotlib.pyplot as plt
from sklearn import svm
from sklearn.metrics import roc_curve, auc
from sklearn.model_selection import StratifiedKFold

#交叉验证
cv = StratifiedKFold(n_splits=10)    #导入该模型,后面将数据划分6份
classifier = svm.SVC(kernel='rbf',gamma=0.0001,C=1000, probability=True,random_state=0)   # SVC模型 可以换作AdaBoost模型试试

# 画平均ROC曲线的两个参数
mean_tpr = 0.0              # 用来记录画平均ROC曲线的信息
mean_fpr = np.linspace(0, 1, 100)
cnt = 0
for i, (train, test) in enumerate(cv.split(X,Y)):       #利用模型划分数据集和目标变量 为一一对应的下标
    cnt +=1
    probas_ = classifier.fit(X[train], Y[train]).predict_proba(X[test]) # 训练模型后预测每条样本得到两种结果的概率
    fpr, tpr, thresholds = roc_curve(Y[test], probas_[:, 1])    # 该函数得到伪正例、真正例、阈值,这里只使用前两个

    mean_tpr += np.interp(mean_fpr, fpr, tpr)   # 插值函数 interp(x坐标,每次x增加距离,y坐标)  累计每次循环的总值后面求平均值
    mean_tpr[0] = 0.0           # 将第一个真正例=0 以0为起点

    roc_auc = auc(fpr, tpr)  # 求auc面积
    plt.plot(fpr, tpr, lw=1, label='ROC fold {0:.2f} (area = {1:.2f})'.format(i, roc_auc))    # 画出当前分割数据的ROC曲线

plt.plot([0, 1], [0, 1], '--', color=(0.6, 0.6, 0.6), label='Luck') # 画对角线

mean_tpr /= cnt   # 求数组的平均值
mean_tpr[-1] = 1.0   # 坐标最后一个点为(1,1)  以1为终点
mean_auc = auc(mean_fpr, mean_tpr)

plt.plot(mean_fpr, mean_tpr, 'k--',label='Mean ROC (area = {0:.2f})'.format(mean_auc), lw=2)

plt.xlim([-0.05, 1.05])     # 设置x、y轴的上下限,设置宽一点,以免和边缘重合,可以更好的观察图像的整体
plt.ylim([-0.05, 1.05])
plt.xlabel('False Positive Rate')
plt.ylabel('True Positive Rate')    # 可以使用中文,但需要导入一些库即字体
plt.title('Receiver operating characteristic example')
plt.legend(loc="lower right")
plt.show()


#保存模型
from sklearn.externals import joblib
os.chdir("G:/Download_Data_bishe/save_model")
joblib.dump(classifier,"train_model.m")

# #只有交叉验证
# clf = SVC(kernel='rbf',gamma=0.001,C=100)
# scores = cross_val_score(clf, X , Y , cv=5)  #cv为迭代次数。
# print(scores)  # 打印输出每次迭代的度量值(准确度)
# print(scores.mean())
# print()


#普通的一次性模型训练预测
#clf = SVC(kernel='rbf',gamma=0.001,C=100)
# clf.fit(X_train, y_train)#训练
# predictions0 = clf.predict(X_test)
# #predictions0=pred_test_y
# print(confusion_matrix(y_test, predictions0))
# print (classification_report(y_test, predictions0))
# endtime = datetime.datetime.now()
# print (endtime - starttime)


# #自动调参函数
# tuned_parameters = [{'kernel': ['rbf'], 'gamma': [1e-3, 1e-4],
#                       'C': [1, 10, 100, 1000]},
#                     {'kernel': ['linear'], 'C': [1, 10, 100, 1000]}]
# scores = ['precision', 'recall']
# for score in scores:
#     print("# Tuning hyper-parameters for %s" % score)
#     print()
#
#     # 调用 GridSearchCV,将 SVC(), tuned_parameters, cv=5, 还有 scoring 传递进去,
#     clf = ms.GridSearchCV(svm.SVC(), tuned_parameters, cv=10,
#                        scoring='%s_macro' % score) #cv为迭代次数。#基于交叉验证的网格搜索,cv:确定交叉验证拆分策略。
#     # 用训练集训练这个学习器 clf
#     clf.fit(X_train, y_train)
#
#     print("Best parameters set found on development set:")
#     print()
#
#     # 再调用 clf.best_params_ 就能直接得到最好的参数搭配结果
#     print(clf.best_params_)
#
#     print()
#     print("Grid scores on development set:")
#     print()
#     means = clf.cv_results_['mean_test_score']
#     stds = clf.cv_results_['std_test_score']
#
#     # 看一下具体的参数间不同数值的组合后得到的分数是多少
#     for mean, std, params in zip(means, stds, clf.cv_results_['params']):
#         print("%0.3f (+/-%0.03f) for %r"
#              % (mean, std * 2, params))
#
#     print()
#
#     print("Detailed classification report:")
#     print()
#     print("The model is trained on the full development set.")
#     print("The scores are computed on the full evaluation set.")
#     print()
#     y_true, y_pred = y_test, clf.predict(X_test)
#
#     # 打印在测试集上的预测结果与真实值的分数
#     print(classification_report(y_true, y_pred))
#
#     print()
