echarts柱状图之颜色渐变

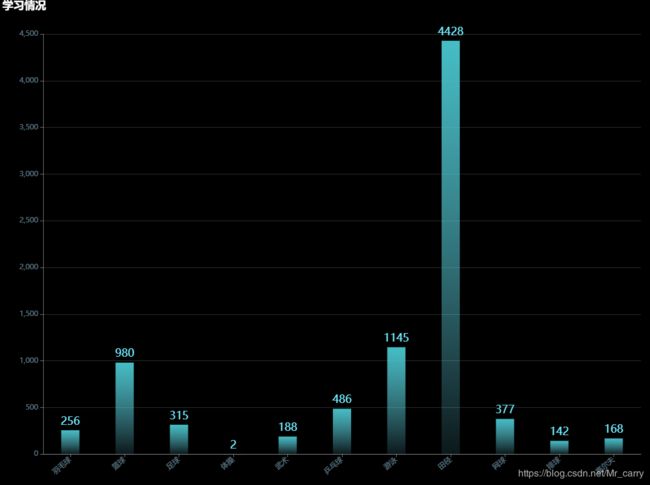
效果:

echarts柱状图之颜色渐变_第1张图片

代码:

option = {
    backgroundColor: 'b',
          title:{
            text: '学习情况',
            textStyle:{
              color:'#fff'
            }
          } ,
          tooltip : {
            trigger: 'axis',
            axisPointer : {            // 坐标轴指示器,坐标轴触发有效
              type : 'shadow'        // 默认为直线,可选为:'line' | 'shadow'
            }
          },
          grid: {
            left: '3%',
            right: '4%',
            bottom: '3%',
            containLabel: true
          },
          xAxis : [
            {
              type : 'category',
              axisLine: {/*坐标轴,轴线的设置*/
                lineStyle: {
                  color: "rgba(224,224,224,0.5)",
                }
              },
              axisLabel: {
                interval:0,
                rotate:40 ,
                textStyle: {
                  color: "rgba(169,226,251,0.5)"
                }
              },
              data : ['羽毛球', '篮球',
                '足球','体操','武术','乒乓球',
                '游泳','田径','网球','排球',
                '高尔夫'],
              axisTick: {
                alignWithLabel: true
              }
            }
          ],
          yAxis : [
            {
              type : 'value',
              splitNumber: '7',
              axisLine: {/*坐标轴,轴线的设置*/
                lineStyle: {
                  color: "rgba(224,224,224,0.5)",
                }
              },
              splitLine: {
                show: true,
                lineStyle:{
                  color: 'rgba(224,224,224,0.2)'
                }
              },
              axisLabel: { /*坐标轴的刻度文字设置*/
                formatter: '{value}',
                textStyle: {
                  color: "rgba(169,226,251,0.5)"
                }
              }
            }
          ],
          series : [
            {
              type:'bar',
              barWidth: '30',
              data:[256, 980, 315, 2, 188, 486, 1145,4428, 377, 142, 168],
              itemStyle: {
                normal: {
                  color: new echarts.graphic.LinearGradient(0, 0, 0, 1, [{
                    offset: 0,
                    color: '#45bdc5'
                  }, {
                    offset: 1,
                    color: 'rgba(113,237,255,0.1)'
                  }]),
                }
              },
              label: {
                show: true, //开启显示
                position: 'top', //在上方显示
                textStyle: { //数值样式
                  color: 'rgba(113,237,255,1)',
                  fontSize: '18'
                }
              }
            }
          ]
        };
 

你可能感兴趣的:(echarts)