我觉得应该要把主成分的学习梳理一遍。
网上查了查,跟着大神们的节奏走一遍。主要学习了
https://www.jianshu.com/p/6e413420407a 这篇文章
光看不练没有用,要跑一遍代码才行。这里就记录一下跑代码的过程
- 安装包
install.packages(c("FactoMineR", "factoextra","corrplot"))
library("FactoMineR")
library("factoextra")
library("corrplot")
这些包具体什么用参考这位作者的文章https://www.jianshu.com/u/fe854ffa1f9e
- 看一下数据情况. 数据是内置的
> head(decathlon2)
          X100m Long.jump Shot.put High.jump X400m X110m.hurdle Discus
SEBRLE    11.04      7.58    14.83      2.07 49.81        14.69  43.75
CLAY      10.76      7.40    14.26      1.86 49.37        14.05  50.72
BERNARD   11.02      7.23    14.25      1.92 48.93        14.99  40.87
YURKOV    11.34      7.09    15.19      2.10 50.42        15.31  46.26
ZSIVOCZKY 11.13      7.30    13.48      2.01 48.62        14.17  45.67
McMULLEN  10.83      7.31    13.76      2.13 49.91        14.38  44.41
          Pole.vault Javeline X1500m Rank Points Competition
SEBRLE          5.02    63.19  291.7    1   8217    Decastar
CLAY            4.92    60.15  301.5    2   8122    Decastar
BERNARD         5.32    62.77  280.1    4   8067    Decastar
YURKOV          4.72    63.44  276.4    5   8036    Decastar
ZSIVOCZKY       4.42    55.37  268.0    7   8004    Decastar
McMULLEN        4.42    56.37  285.1    8   7995    Decatur
- 获取需要的数据,并查看
> decathlon2.active <- decathlon2[1:23, 1:10]
> head(decathlon2.active)
          X100m Long.jump Shot.put High.jump X400m X110m.hurdle Discus
SEBRLE    11.04      7.58    14.83      2.07 49.81        14.69  43.75
CLAY      10.76      7.40    14.26      1.86 49.37        14.05  50.72
BERNARD   11.02      7.23    14.25      1.92 48.93        14.99  40.87
YURKOV    11.34      7.09    15.19      2.10 50.42        15.31  46.26
ZSIVOCZKY 11.13      7.30    13.48      2.01 48.62        14.17  45.67
McMULLEN  10.83      7.31    13.76      2.13 49.91        14.38  44.41
          Pole.vault Javeline X1500m
SEBRLE          5.02    63.19  291.7
CLAY            4.92    60.15  301.5
BERNARD         5.32    62.77  280.1
YURKOV          4.72    63.44  276.4
ZSIVOCZKY       4.42    55.37  268.0
McMULLEN        4.42    56.37  285.1
- 做PCA分析 使用自带标准化函数
res.pca <- PCA(X = decathlon2.active, scale.unit =
                 TRUE, ncp = 10, graph = T)
参数: X 为输入的数据集、scale.unit为 是否要标准化、ncp= 最后保留几个主成分、graph 要不要看图
分析还是很快的。
- 看一下给了哪些结果
> print(res.pca)
**Results for the Principal Component Analysis (PCA)**
The analysis was performed on 23 individuals, described by 10 variables
*The results are available in the following objects:

   name               description
1  "$eig"             "eigenvalues"
2  "$var"             "results for the variables"
3  "$var$coord"       "coord. for the variables"
4  "$var$cor"         "correlations variables - dimensions"
5  "$var$cos2"        "cos2 for the variables"
6  "$var$contrib"     "contributions of the variables"
7  "$ind"             "results for the individuals"
8  "$ind$coord"       "coord. for the individuals"
9  "$ind$cos2"        "cos2 for the individuals"
10 "$ind$contrib"     "contributions of the individuals"
11 "$call"            "summary statistics"
12 "$call$centre"     "mean of the variables"
13 "$call$ecart.type" "standard error of the variables"
14 "$call$row.w"      "weights for the individuals"
15 "$call$col.w"      "weights for the variables"
我们发现给的内容很多,而且是按照层次递进的,所以非常不错,但是其实理解起来有点费劲,这里先学几个
可以直接看,不过用factoextra看更加好
> res.pca$eig
        eigenvalue percentage of variance
comp 1   4.1242133              41.242133
comp 2   1.8385309              18.385309
comp 3   1.2391403              12.391403
comp 4   0.8194402               8.194402
comp 5   0.7015528               7.015528
comp 6   0.4228828               4.228828
comp 7   0.3025817               3.025817
comp 8   0.2744700               2.744700
comp 9   0.1552169               1.552169
comp 10  0.1219710               1.219710
        cumulative percentage of variance
comp 1                           41.24213
comp 2                           59.62744
comp 3                           72.01885
comp 4                           80.21325
comp 5                           87.22878
comp 6                           91.45760
comp 7                           94.48342
comp 8                           97.22812
comp 9                           98.78029
comp 10                         100.00000
> eig.val <- get_eigenvalue(res.pca)
> eig.val
       eigenvalue variance.percent cumulative.variance.percent
Dim.1   4.1242133        41.242133                    41.24213
Dim.2   1.8385309        18.385309                    59.62744
Dim.3   1.2391403        12.391403                    72.01885
Dim.4   0.8194402         8.194402                    80.21325
Dim.5   0.7015528         7.015528                    87.22878
Dim.6   0.4228828         4.228828                    91.45760
Dim.7   0.3025817         3.025817                    94.48342
Dim.8   0.2744700         2.744700                    97.22812
Dim.9   0.1552169         1.552169                    98.78029
Dim.10  0.1219710         1.219710                   100.00000
fviz_eig(res.pca, addlabels = TRUE, ylim = c(0, 50))
fviz_pca_ind(res.pca)
Visualize the results individuals.
fviz_pca_var(res.pca)
Visualize the results variables.
这张图也可以称为变量相关图,它展示了变量组内包括和主成分之间的关系,正相关的变量是彼此靠近的,负相关的变量师南辕北辙的,而从中心点到变量的长度则代表着变量在这个维度所占的比例(也可以理解为质量,quality)
来源:https://www.jianshu.com/p/6e413420407a
接着来看一下
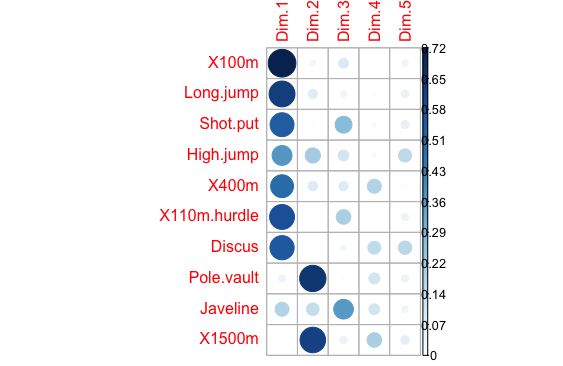
> var$cos2
                    Dim.1        Dim.2       Dim.3        Dim.4
X100m        7.235641e-01 0.0321836641 0.090936280 0.0011271597
Long.jump    6.307229e-01 0.0788806285 0.036307981 0.0133147506
Shot.put     5.386279e-01 0.0072938636 0.267907488 0.0165041211
High.jump    3.722025e-01 0.2164242070 0.108956221 0.0208947375
X400m        4.922473e-01 0.0842034209 0.080390914 0.1856106269
X110m.hurdle 5.838873e-01 0.0006121077 0.201499837 0.0002854712
Discus       5.523596e-01 0.0024662013 0.031161138 0.1560322304
Pole.vault   4.720540e-02 0.6519772763 0.008846856 0.1149106765
Javeline     1.833781e-01 0.1490803723 0.364966189 0.1100478063
X1500m       1.830545e-05 0.6154091638 0.048167378 0.2007126089
                  Dim.5
X100m        0.03780845
Long.jump    0.05436203
Shot.put     0.06190783
High.jump    0.16216747
X400m        0.01079698
X110m.hurdle 0.05027463
Discus       0.16665918
Pole.vault   0.04914437
Javeline     0.03912992
X1500m       0.06930197
做个图看看哪些质量高,贡献大
corrplot(var$cos2, is.corr=FALSE)
这个是quality
还有一个Contributions
corrplot(var$contrib, is.corr=FALSE)
还是有点区别的
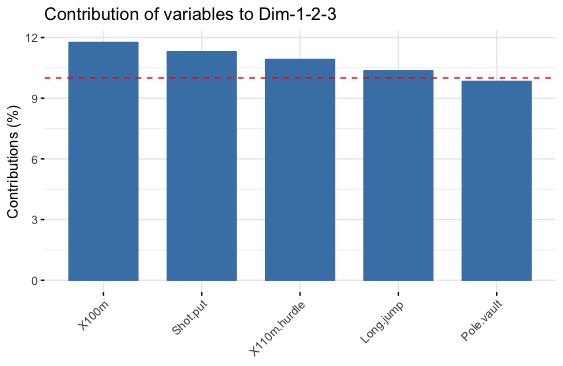
还有一种自带的画图,可以自己设定对几个主成分叠加的贡献度,还会出一条红线来表示平均贡献度
fviz_contrib(res.pca, choice = "var", axes = 1:3, top = 5)
再补充一个 correspondence analysis 对应分析
对应分析是一种多元分析统计技术。主要用于研究分类变量构成的交叉表,已揭示变量间的关系,并将交叉表的信息以图形的方式展示出来。它主要适用于有多个类别的分类变量,可以揭示同一个变量各个类别之间的差异,以及不同变量各个类别之间的对应关系。简单说,对应分析就是交叉表的图形化。对应分析看似是一种作图的技术,实际上难点在于变量的选择。有些变量被忽视掉之后,分析结果就可能以偏概全,没有揭示变量间真正的关系。所以在通常情况下,可以通过尝试不同变量的组合,以发现具有价值的信息。而对应分析的作用就是用图形的方式表达分类变量之间的关系。
The data used here is a contingency table that summarizes the answers given by different categories of people to the following question: “according to you, what are the reasons that can make hesitate a woman or a couple to have children?” The data frame is made of 18 rows and 8 columns. Rows represent the different reasons mentioned, columns represent the different categories (education, age) people belong to.
是什么原因导致你和你们夫妻还不想要小孩
18行 8列
行代表原因 列代表不同的问的人的属性
先来看数据集 也是内置的
data("children")
直接出结果
res.ca <- CA(children, col.sup = 6:8, row.sup = 15:18)
选择性出结果
plot(res.ca, invisible = c("row.sup", "col.sup"))
具体应用可以参考:
https://blog.csdn.net/muyashui/article/details/82755167


