Qt开发总结(21)——Qwt第三方绘图组件
上两篇分别记录了Qt的二维图表charts和三维图表Data Visualization,我们已经有感于它的强大和方便,但是我还是想写一写我使用了N年之久的qwt,一款强大的第三库方Qt库表库,它支持从Qt4.4到Qt5的所有版本,具有丰富的图表类,在那个Qt Charts和Data Visualization还是收费内容的时代,真的为开发人员提供了很大的帮助。
下载与安装
本篇笔记涉及的qwt是qwt官方6.1.3版本,Qt版本是Qt5.9.7。可以到官网下载:
http://www.sourceforge.net/projects/qwt/files
下载到的是源码,qwt并不提供编译好的库文件。于是我们需要做的第一件事就是结合本地的qt版本进行编译。我们下载到的zip压缩包解压缩到某一目录下,比如:C:/qwt-6.1.3/。打开qwtconfig.pri工程文件对工程进行配置,主要需要关系安装路径:
Install paths下有QWT_INSTALL_PREFIX = C:/Qwt-$$QWT_VERSION字段,可以改为自己的安装路径。其他的可以不改,如果你确实只想编译其中的部分控件功能,可以在下面的QWT_CONFIG字段进行删减。
简单的配置或是不做任何配置后,用Qt Creator打开qwt.pro工程,用本地的编译器configure之后直接构建就好了。如果你用命令行的话,不论是在windows还是在linux下都类似:
1.qmake qwt.pro
2.nmake (windows MSVC)或make(linux)
3.nmake install(windows MSVC)或sudo make install(linux)
生成了lib文件夹,内含Release下使用的qwt.lib qwt.dll和debug模式下使用的qwtd.lib qwtd.dll文件。建议直接拷贝到安装目录下C:/qwt-6.1.3/。在具体使用时可以在VS中设置该lib路径,在windows环境变量中添加path中dll的路径,或将这些库文件拷贝到工程目录下即可使用。当然,还需要设置include的路径,即C:\qwt-6.1.3\include。
常用类汇总
QwtAbstractScale: 包含刻度尺的所有类的抽象基类
QwtAbstractScaleDraw: 绘制刻度尺的抽象基类
QwtAbstractSlider: 滑块部件的抽象基类
QwtAlphaColorMap: 可以改变颜色的alpha值
QwtAnalogClock: 时钟的模拟类
QwtArrayData: 包含2个QwtArray
QwtArrowButton: 箭头按钮
QwtClipper: 剪贴板类
QwtColorMap: 提供数值到颜色的映射功能
QwtCompass: 指南针部件
QwtCompassMagnetNeedle: 指南针部件的磁针
QwtCompassRose: 罗盘部件的抽象基类
QwtCompassWindArrow: 风向标的指示器
QwtPlot: 地基容器,里面可放其他对象
QwtPlotItem: 负责控制绘图数据的产生和传递,并绘制一个坐标轴
QwtPlotCurve: 曲线类,用于绘制各种曲线
QwtPlotMarker: 标尺类,用于绘制刻度线
QwtData: 定义任何曲线类型的数据接口
QwtPlotGrid: 网格
QwtPlotHistogram: 直方图
QwtPlotBarChart: 条形图表
QwtPlotMultiBarChart: 成组的条形图表——堆叠或并排对齐
QwtPlotShapeItem: 显示矩形、圆、多边形和其他所有的形状的plot item,可以用QPainterPah表示
QwtPlotTextLabel: 和QwtPlotMarker相反,文本不是基于plot坐标排列,而是根据画布(canvas)的几何形状(geometry)
QwtScaleTransformation已经被QwtTransform和QwtNullTransform、QwtLogTransform、QwtPowerTransform替换
QwtDate: 在QDateTime和Double之间转换的方法的集合
QwtPlotPanner: 平移器(用鼠标左键平移)
QwtPlotMagnifier: 放大器(用鼠标滚轮缩放)
QwtPlotCanvas: 画布
QwtScaleMap: 比例图( 可以提供一个逻辑区域到实际区域的坐标转换 )
QwtScaleWidget: 比例窗口
QwtScaleDiv: 比例布局
QwtLegent: 标注
QwtPlotLayout: 布局管理器
QwtScaleDraw: 自画坐标轴
QwtPlot绘制二维曲线
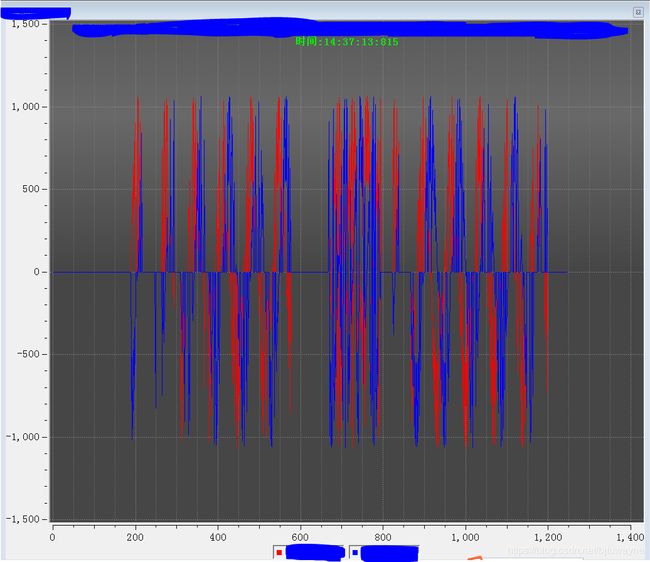
自己编写了一个通过QwtPlot绘制二维曲线的定制类,该类中应用了QwtPlotGrid设置栅格显示,通过QwtLegend设置图例,通过QwtPlotCurve添加曲线,通过QwtText设置文字标注,通过QwtPlotZoomer设置区域缩放,通过QwtPlotRenderer把绘图区域生成pdf文件,通过QwtPlotItem显示某点的坐标值等。效果图:
上源码:
//CPlot.h
#ifndef CPLOT_H
#define CPLOT_H

#include
#include
#include
#include
#include
#include
#include
#include
#include
#include
#include
#include

class CPlot : public QwtPlot
{
	Q_OBJECT

public:
	CPlot(QWidget *parent = 0);
	virtual ~CPlot();
private:
	int CurNum;
	QVector  m_curve;
	QwtPlotZoomer *m_zoomer[2];//绘图插件的鼠标放大缩小功能
	QwtPlotTextLabel *InfoLabel;

private:
	void InsertLegnd();
	void SetZoom();

public:
	virtual void replot();
	void InsertCurve(QString Title, QColor color);
	QwtPlotCurve *Curve(int nId);
	void PlotCurve(const int curId, const double *xData, const double *yData, const int Len);
	void PlotCurve(const int curId,  QVector &xData, const QVector &yData);
	void InsertText(QString str, int pos);
	void ClearCuerve();
	void RemoveCurve(int id);
	void ExportCurPdf();
private slots:
	void showItem(const QVariant &itemInfo, bool on);
};

#endif // CPLOT_H

//CPlot.cpp
#include "cplot.h"

CPlot::CPlot(QWidget *parent)
	: QwtPlot(parent),
	CurNum(0)
{
	//变量初始化
	m_zoomer[0] = NULL;
	m_zoomer[1] = NULL;
	InfoLabel = new QwtPlotTextLabel();
	//设置背景布
	QLinearGradient gradient(0, 0, 0, 400); //背景布
	gradient.setColorAt(0, QColor(90, 90, 90));
	gradient.setColorAt(0.38, QColor(105, 105, 105));
	gradient.setColorAt(1, QColor(70, 70, 70));
	this->setCanvasBackground(QBrush(gradient));

	this->setAutoReplot( false );
	//设置网格
	QwtPlotGrid *grid = new QwtPlotGrid;
	grid->enableXMin( true );
	grid->setMajorPen( Qt::gray, 0, Qt::DotLine );
	grid->setMinorPen( Qt::darkGray, 0, Qt::DotLine );
	grid->attach( this );

	//自动适应的坐标轴设置
	this->setAxisAutoScale(QwtPlot::yLeft, true);
	this->setAxisAutoScale(QwtPlot::xBottom, true);
	QwtScaleDraw *scaleDraw = axisScaleDraw(QwtPlot::yLeft);
	if (scaleDraw)
	{
		scaleDraw->enableComponent(QwtAbstractScaleDraw::Backbone,false);
	}
	//this->setAxisScaleDraw(QwtPlot::yLeft, )

	//设置线宽
	this->setLineWidth( 0 );

	//图例
	InsertLegnd();
	//缩放
	SetZoom();
}
void CPlot::InsertLegnd()
{
	QwtLegend *legend = new QwtLegend;
	legend->setDefaultItemMode(QwtLegendData::Checkable);
	this->insertLegend( legend,QwtPlot::BottomLegend);
	connect(legend, SIGNAL(checked(const QVariant &, bool, int)),this,  SLOT(showItem(const QVariant &, bool)));
}
void CPlot::replot()
{
	QwtPlot::replot();

}
void CPlot::InsertCurve(QString Title, QColor color)
{

	QwtPlotCurve *Cur = new QwtPlotCurve();
	Cur->setTitle(Title);
	Cur->setPen(color);
	m_curve.append(Cur);
	Cur->attach( this );

	//图例
	QwtLegend *lgd = qobject_cast( legend() );

	QList legendWidgets =
		lgd->legendWidgets( itemToInfo( Cur ) );

	if ( legendWidgets.size() == 1 )
	{
		QwtLegendLabel *legendLabel =
			qobject_cast( legendWidgets[0] );

		if ( legendLabel )
			legendLabel->setChecked( true );
	}

	CurNum++;
}
QwtPlotCurve * CPlot::Curve(int nId)
{
	if (m_curve[nId] != NULL)
	{
		return m_curve[nId];
	}
	else
	{
		return NULL;
	}
}
void CPlot::PlotCurve(const int curId, const double *xData, const double *yData, const int Len)
{
	if(curId >= m_curve.size())
	{
		QMessageBox::critical(this, tr("警告"), tr("未添加第%1条曲线").arg(curId));
		return;
	}
	if (m_curve[curId] != NULL)
	{
		m_curve[curId]->setSamples(xData,yData,Len);
		m_curve[curId]->attach(this);
	}

	//自动适应的坐标轴设置
	this->setAxisAutoScale(QwtPlot::yLeft, true);
	this->setAxisAutoScale(QwtPlot::xBottom, true);
	this->replot();
	SetZoom();

}
void CPlot::PlotCurve(const int curId, QVector &xData, const QVector &yData)
{
	if(curId >= m_curve.size())
	{
		QMessageBox::critical(this, tr("警告"), tr("未添加第%1条曲线").arg(curId));
		return;
	}
	if (m_curve[curId] != NULL)
	{
		m_curve[curId]->setSamples(xData,yData);
		m_curve[curId]->attach(this);
	}

	//自动适应的坐标轴设置
	this->setAxisAutoScale(QwtPlot::yLeft, true);
	this->setAxisAutoScale(QwtPlot::xBottom, true);
	this->replot();
	SetZoom();
}
void CPlot::InsertText(QString str, int pos)
{
	QwtText TextLabel( str );
	TextLabel.setRenderFlags( pos );
	QFont font;
	font.setBold( true );
	font.setPointSize(10);
	TextLabel.setFont( font );
	TextLabel.setColor(Qt::green);
	InfoLabel->setText(TextLabel);
	InfoLabel->attach(this);
}
void CPlot::SetZoom()
{
	//此处创建左键缩放功能可以使得右键恢复至适应之后的坐标轴
	//清理缩放功能信息
	if (m_zoomer[0] != NULL)
	{
		delete m_zoomer[0];
		m_zoomer[0] =NULL;
	}
	if (m_zoomer[1] != NULL)
	{
		delete m_zoomer[1];
		m_zoomer[1] =NULL;
	}
	m_zoomer[0] = new QwtPlotZoomer( QwtPlot::xBottom, QwtPlot::yLeft,
		this->canvas() );
	m_zoomer[1] = new QwtPlotZoomer( QwtPlot::xTop, QwtPlot::yRight,
		this->canvas() );
	for (int i=0; i<2; ++i)
	{
		m_zoomer[i]->setTrackerMode( QwtPicker::AlwaysOff );
		m_zoomer[i]->setRubberBand( QwtPicker::NoRubberBand );
		// 右键: 恢复1次
		// Ctrl+右键: 直接回到原始
		m_zoomer[i]->setMousePattern( QwtEventPattern::MouseSelect2,
			Qt::RightButton, Qt::ControlModifier );
		m_zoomer[i]->setMousePattern( QwtEventPattern::MouseSelect3,
			Qt::RightButton );
	}
	m_zoomer[0]->setRubberBand( QwtPicker::RectRubberBand );
	m_zoomer[0]->setRubberBandPen( QColor( Qt::green ) );
	m_zoomer[0]->setTrackerMode( QwtPicker::ActiveOnly );
	m_zoomer[0]->setTrackerPen( QColor( Qt::white ) );

	m_zoomer[0]->setEnabled( true );
	m_zoomer[0]->zoom( 0 );
	m_zoomer[1]->setEnabled( true );
	m_zoomer[1]->zoom( 0 );
}
void CPlot::RemoveCurve(int id)
{
	if (id >= m_curve.size())
	{
		return;
	}
	//for (int i=0; isetSamples(NULL);
	//}
	delete m_curve[id];
	m_curve[id] = NULL;
	//m_curve.remove(id);
	this->replot();
}
void CPlot::ClearCuerve()
{
	for (int i=0; isetSamples(NULL);
	}
	this->replot();
}
void CPlot::ExportCurPdf()
{
	QwtPlotRenderer renderer;
	renderer.exportTo( this, "*.pdf" );
}
CPlot::~CPlot()
{
	for (int i=0; isetVisible(on);
	}
	this->replot();
}
