echarts自定义柱状图图形渲染,坐标轴指示器吸附在柱状图中间而不是最左侧
原本柱状图坐标轴指示器自动吸附数据trigger: 'axis',是吸附横坐标的最小值
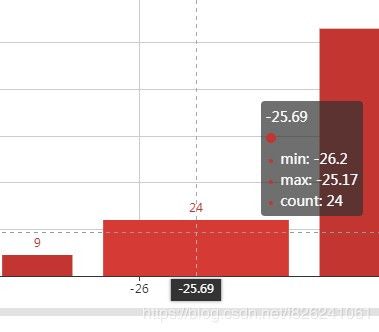
将后端传入数据[min,max,high]改为[mid,min,max,high]
for(int i = 0; i < classes.size(); i++) {

	if(classes.get(i).classifier_cell.size()>1) {
		ArrayList currentarray = new ArrayList();
		currentarray.add((classes.get(i).max+classes.get(i).min)/2);//中值
		currentarray.add(classes.get(i).min);//最小值
		currentarray.add(classes.get(i).max);//最大值
		currentarray.add((double) classes.get(i).classifier_cell.size());//count
		data.add(currentarray);
	}

}
m.put("data", data);
前段修改渲染方式
如下是官网自定义柱状图示例
https://www.echartsjs.com/examples/zh/editor.html?c=custom-profit
var data = [[10, 16, 3, 'A'], [16, 18, 15, 'B'], [18, 26, 12, 'C'], [26, 32, 22, 'D'], [32, 56, 7, 'E'], [56, 62, 17, 'F']];
var colorList = ['#4f81bd', '#c0504d', '#9bbb59', '#604a7b', '#948a54', '#e46c0b'];

data = echarts.util.map(data, function (item, index) {
    return {
        value: item,
        itemStyle: {
            normal: {
                color: colorList[index]
            }
        }
    };
});

function renderItem(params, api) {
    var yValue = api.value(2);
    var start = api.coord([api.value(0), yValue]);
    var size = api.size([api.value(1) - api.value(0), yValue]);
    var style = api.style();

    return {
        type: 'rect',
        shape: {
            x: start[0],
            y: start[1],
            width: size[0],
            height: size[1]
        },
        style: style
    };
}

option = {
    title: {
        text: 'Profit',
        left: 'center'
    },
    tooltip: {
    },
    xAxis: {
        scale: true
    },
    yAxis: {
    },
    series: [{
        type: 'custom',
        renderItem: renderItem,
        label: {
            normal: {
                show: true,
                position: 'top'
            }
        },
        dimensions: ['from', 'to', 'profit'],
        encode: {
            x: [0, 1],
            y: 2,
            tooltip: [0, 1, 2],
            itemName: 3
        },
        data: data
    }]
};
随意修改,思路是把数据模板的[mid,min,max,high]的mid空出来
	function renderItem(params, api) {
	    var yValue = api.value(3);
	    var start = api.coord([api.value(1), yValue]);
	    var xValue = api.value(2) - api.value(1);
	    if(xValue==0){
	    	start = api.coord([api.value(1)-0.01,yValue]);
	        xValue=0.02;
	    }
	    var size = api.size([xValue, yValue]);
   		 var style = api.style();

    return {
        type: 'rect',
        shape: {
            x: start[0],
            y: start[1],
            width: size[0],
            height: size[1]
        },
        style: style
    };
}
然后修改encode部分的x:[0,2],y:3
坐标轴指示器数据依附会自动依附到第一个值,此处的x轴取值不影响渲染
series: [{
             type: 'custom',
             renderItem: renderItem,
             label: {
             normal: {
                 show: true,
                 position: 'top'
             }
          },
          dimensions: ['mid','min', 'max', 'count'],
          encode: {
              x: [0, 2],
              y: 3,
              tooltip: [1, 2, 3],
              itemName: 0
          },
          data: []
     }],