丁香园“新型冠状病毒肺炎”论坛的数据爬取和分析
来源:KOTO - kesci.com
原文链接:丁香园–新型冠状病毒肺炎论坛的数据爬取和分析
DXY.com丁香园是国内最大的医学综合网站之一,其医学论坛聚集了国内的专业人士。本文选取其中的论坛(新型冠状病毒肺炎)抓取数据来分析人们对于疫情的讨论关注
一、获取数据
从dxy.com获取数据
import pandas as pd
import numpy as np
import re
import urllib.request
from bs4 import BeautifulSoup
from tqdm import tqdm
from collections import Counter
import matplotlib.pyplot as plt
# url="http://www.dxy.cn/bbs/board/288?age=30&tpg=1"
# req= urllib.request.urlopen(url)
# soup=BeautifulSoup(req,"html.parser")
# print(soup)
info_1=[]
info_2=[]
info_3=[]
info_4=[]
info_5=[]
info_6=[]
info_7=[]
with tqdm(range(1,28)) as t:
    for j in t:
        url="http://www.dxy.cn/bbs/board/288?age=30&tpg=%a"%j
        req=urllib.request.urlopen(url)
        soup=BeautifulSoup(req,"html.parser")
        links=soup.find_all("td",attrs={"class":"news"})
        # print(len(links))
        for i in range(len(links)):
            title=soup.select('#col-1 > table.post-table > tbody > tr:nth-child('+str(i+1)+') > td.news > a')
            a=title[0].get_text()
            info_1.append(a)

            author=soup.select('#col-1 > table.post-table > tbody > tr:nth-child('+str(i+1)+') > td:nth-child(3) > a')
            a=author[0].get_text()
            info_2.append(a)

            first_time=soup.select('#col-1 > table.post-table > tbody > tr:nth-child('+str(i+1)+') > td:nth-child(3) > em')
            a=first_time[0].get_text()
            info_3.append(a)

            reply_num=soup.select('#col-1 > table.post-table > tbody > tr:nth-child('+str(i+1)+') > td.num.calign > a')
            a=reply_num[0].get_text()
            info_4.append(a)

            click_num=soup.select('#col-1 > table.post-table > tbody > tr:nth-child('+str(i+1)+') > td.num.calign > em')
            a=click_num[0].get_text()
            info_5.append(a)

            last_replaier=soup.select('#col-1 > table.post-table > tbody > tr:nth-child('+str(i+1)+') > td.by.ralign.last > a')
            a=last_replaier[0].get_text()
            info_6.append(a)

            last_time=soup.select('#col-1 > table.post-table > tbody > tr:nth-child('+str(i+1)+') > td.by.ralign.last > em')
            a=last_time[0].get_text()
            info_7.append(a)

t.close()
df=pd.DataFrame({'content':info_1,'author':info_2,'post_time':info_3,'reply_num':info_4,
'click_num':info_5,'last_reply':info_6,'reply_time':info_7})
df.to_csv("forum.csv",index=True,sep=',')
df.head()
二、数据清洗
df.isna().any() # 查空值
content       False
author        False
post_time     False
reply_num     False
click_num     False
last_reply    False
reply_time    False
dtype: bool
df[df.isna().values == True] # 检查具体缺失值的数据
df = df.dropna(axis=0)
df.isna().any()  # 查空值
content       False
author        False
post_time     False
reply_num     False
click_num     False
last_reply    False
reply_time    False
dtype: bool
df.duplicated().any() # 查询有无重复值
False
df[df.duplicated().values == True] # 查询具体重复数据
df = df.drop_duplicates()  # 去重复值
df.duplicated().any()  # 再次检查确认有无重复
False
df.info()
Int64Index: 943 entries, 0 to 942
Data columns (total 7 columns):
content       943 non-null object
author        943 non-null object
post_time     943 non-null object
reply_num     943 non-null object
click_num     943 non-null object
last_reply    943 non-null object
reply_time    943 non-null object
dtypes: object(7)
memory usage: 58.9+ KB
三、分析处理数据
df['reply_num']=df['reply_num'].astype('float')
df['reply_num'].describe()  # 查看帖子回复情况的统计值
count     943.000000
mean       24.067869
std        90.467069
min         0.000000
25%         0.000000
50%         2.000000
75%        10.000000
max      1953.000000
Name: reply_num, dtype: float64
回复最多的帖子有1956次,平均回复12.025668次。
查看回复最多的100条帖子
df_re = df.sort_values('reply_num', ascending=False).iloc[:100, :]  # 按回复降序排列
df_re.head()
前100热门帖子有无同一个人发表的,显示是有的
df_re['author'].duplicated().any() # 前100热门帖子有无同一个人发表的
True
df_re[df_re['author'].duplicated()].count()
content       65
author        65
post_time     65
reply_num     65
click_num     65
last_reply    65
reply_time    65
dtype: int64
Counter(df_re['author']).most_common(5) # 在回复最多的前100个帖子中,发表数量前几位的作者,估计其中资深专家
[('lightningwing', 21),
 ('丁香调查官方账号', 11),
 ('阿呆233', 7),
 ('DR的理想', 6),
 ('安第斯杰克', 5)]
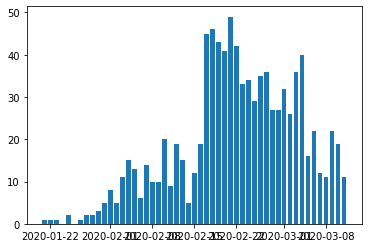
下面我再试试用时间排序可否找出一些论坛发展情况。
按照时间排序
df['counts'] = 1  # 插入一列用来计数
df.head()
df_dateindex = df.sort_values('post_time') # 设置按发表日期排序
df_dateindex.index = pd.to_datetime(df_dateindex['post_time']) # 设置发表日期为index
df_resample_Y = df_dateindex.resample('1D')  # 按天分类统计
df_resample_Y = df_resample_Y
count_by_day = df_resample_Y['counts'].sum()  # 统计每天的发帖量
count_by_day
post_time
2020-01-21     1
2020-01-22     1
2020-01-23     1
2020-01-24     0
2020-01-25     2
2020-01-26     0
2020-01-27     1
2020-01-28     2
2020-01-29     2
2020-01-30     3
2020-01-31     5
2020-02-01     8
2020-02-02     5
2020-02-03    11
2020-02-04    15
2020-02-05    13
2020-02-06     6
2020-02-07    14
2020-02-08    10
2020-02-09    10
2020-02-10    20
2020-02-11     9
2020-02-12    19
2020-02-13    15
2020-02-14     5
2020-02-15    12
2020-02-16    19
2020-02-17    45
2020-02-18    46
2020-02-19    43
2020-02-20    41
2020-02-21    49
2020-02-22    42
2020-02-23    33
2020-02-24    34
2020-02-25    29
2020-02-26    35
2020-02-27    36
2020-02-28    27
2020-02-29    27
2020-03-01    32
2020-03-02    26
2020-03-03    36
2020-03-04    40
2020-03-05    16
2020-03-06    22
2020-03-07    12
2020-03-08    11
2020-03-09    22
2020-03-10    19
2020-03-11    11
Freq: D, Name: counts, dtype: int64
from pandas.plotting import register_matplotlib_converters
register_matplotlib_converters()
plt.bar(count_by_day.index, count_by_day)  # 画图看一下论坛每天发帖数量趋势
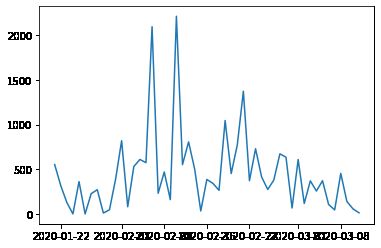
mean_by_day = df_resample_Y['reply_num'].sum()  # 统计每天每贴的平均回复量
mean_by_day
post_time
2020-01-21     553.0
2020-01-22     317.0
2020-01-23     128.0
2020-01-24       0.0
2020-01-25     362.0
2020-01-26       0.0
2020-01-27     227.0
2020-01-28     271.0
2020-01-29      10.0
2020-01-30      46.0
2020-01-31     385.0
2020-02-01     820.0
2020-02-02      80.0
2020-02-03     530.0
2020-02-04     610.0
2020-02-05     574.0
2020-02-06    2097.0
2020-02-07     231.0
2020-02-08     470.0
2020-02-09     160.0
2020-02-10    2214.0
2020-02-11     552.0
2020-02-12     807.0
2020-02-13     502.0
2020-02-14      33.0
2020-02-15     386.0
2020-02-16     342.0
2020-02-17     264.0
2020-02-18    1046.0
2020-02-19     452.0
2020-02-20     772.0
2020-02-21    1374.0
2020-02-22     372.0
2020-02-23     730.0
2020-02-24     414.0
2020-02-25     274.0
2020-02-26     379.0
2020-02-27     673.0
2020-02-28     635.0
2020-02-29      66.0
2020-03-01     609.0
2020-03-02     117.0
2020-03-03     370.0
2020-03-04     256.0
2020-03-05     372.0
2020-03-06     106.0
2020-03-07      45.0
2020-03-08     454.0
2020-03-09     140.0
2020-03-10      57.0
2020-03-11      12.0
Freq: D, Name: reply_num, dtype: float64
plt.plot(mean_by_day.index, mean_by_day) # 画图看一下论坛每天平均回复数的趋势
[]
从第2张图看,论坛在二月初达到了讨论高峰,群众对于疫情发展即为关心。
词频统计
import jieba
import jieba.analyse
import wordcloud  # 词云展示库
from PIL import Image  # 图像处理库
news = df[['content', 'post_time']].sort_values('post_time')
with open('news_data.csv', 'w') as f:
    news.to_csv('news_data.csv')  # 先将数据存档,避免后续调试常从头开始。
news = pd.read_csv('news_data.csv')
news['content'].head()
0          丁香园上线「疫情地图」,帮你实时了解新型肺炎最新进展!
1      最新!武汉同济、武汉协和同时发布新型冠状病毒肺炎快速诊疗指南!
2                    新型肺炎 17 例死亡病例病情介绍
3            最权威的武汉肺炎流行病数据,原来……(知乎咖喱鸡)
4    不缺顶尖医院、有 SARS 前车之鉴,为何武汉仍然每一步都走晚了?
Name: content, dtype: object
punctuation = """【】★“”!,。?、~@#¥%……&*()!?。――"#$%&'<<>>()*+-/:;<=>@[\]^_`{|}~⦅⦆「」、、〃》「」『』【】〔〕〖〗〘〙〚〛〜〝〞〟〰〾〿–—‘'‛“”„‟…‧﹏"""
re_punctuation = "[{}]+".format(punctuation)
remove_words = [u'的', u',', u'和', u'是', u'随着', u'对于', u'对', u'等', u'能', u'都', u'。', u' ', u'、',
                u'中', u'-', u'在', u'了', u'通常', u'如果', u'我们', u'需要', u'什么', u'下', u'一', u'吗', u'有']  # 自定义去除词库

news_list = []
for new in tqdm(news['content']):
    new = str(new)
    new = re.sub(re_punctuation, '', new)  # 去掉一些没用的符号

    seg_list_exact = jieba.cut(new, cut_all=False)  # 精确模式分词
    for word in seg_list_exact:
        if word not in remove_words:  # 如果不在去除词库中
            news_list.append(word)  # 将分词加入 list 中。

news_list[:10]
['丁香', '园', '上线', '疫情', '地图', '帮', '你', '实时', '了解', '新型']
词频统计
word_c = Counter(news_list)  # 对分词词频统计
word_top10 = word_c.most_common(20)  # 获取前20的词
print(word_top10)
[('肺炎', 297), ('新冠', 286), ('冠状病毒', 132), ('疫情', 128), ('新型', 121), ('病毒', 86), ('感染', 65), ('治疗', 61), ('患者', 59), ('武汉', 57), ('医生', 48), ('2', 48), ('方案', 47), ('|', 47), ('医院', 44), ('确诊', 43), ('病例', 41), ('月', 41), ('诊疗', 36), ('关于', 34)]
wc = wordcloud.WordCloud(font_path='C:\Windows\Fonts\msyh.ttc', max_words=100, max_font_size=60)
wc.generate_from_frequencies(word_c)  # 从字典生成词云
plt.imshow(wc)  # 显示词云
plt.axis('off')  # 关闭坐标轴
plt.show()  # 显示图像
最后通过显示词云,可以直观的体现论坛里人民对于疫情的讨论热点


