【转】matlab标题,给figure加标题,subplot的部分用法
原文地址:http://hi.baidu.com/twzbqlzg/item/304ee20fb93de8cb74cd3cce
这段时间正在进行matlab做论文的图片,用到了几个觉得不错的小用法。
不做详细整理了,简单自己做个小笔记。内容均来自网站
1. 用set给figure加标题,改窗口名称。
示例一,摘自http://bbs.matwav.com/viewthread.php?tid=887306
h=figure(1);
set(h,'name','Haar小波变换','Numbertitle','off')
subplot(2,1,1);
plot(x(1:count),y(1:count)), axis([0 12 4 6.5]);
title('原始信号');
subplot(2,1,2);
plot(x(1:count),xd(1:count)), axis([0 12 4 6.5]);
title('重建信号');
这样就行了!
示例二,摘自http://www.ymlib.net/article/sort010/info-451.html,这个里面还有其他的内容,关于画图,以及subplot的,有兴趣可以自己点进去看。
matlab 中subplot函数在画图中的应用如下:
subplot(3,2,1)
plot(x)
title('默认格式')
subplot(3,2,2)
plot(x)
set(gca,'xtick',[1 3 6 8]);
set(gca,'ytick',[]);
title('X自定义间隔,Y关闭')
subplot(3,2,3)
plot(x)
set(gca,'xtick',[1 3 6 8]);
set(gca,'xticklabel',sprintf('%03.4f|',get(gca,'xtick')))
set(gca,'ytick',[2 4 5 7]);
set(gca,'yticklabel',{'Two','Four','Five','Seven'});
title('XY自定义间隔、精度及显示方式')
subplot(3,2,4)
plot(x)
set(gca,'xminortick','on');%style 5
set(gca,'ticklength',[0.05 0.025]);
set(gca,'tickdir','out');
title('XY坐标刻度显示方式')
subplot(3,2,5)
plot(x)
set(gca,'xtick',[min(x) (max(x)+min(x))/2 max(x)]);
set(gca,'ytick',[min(x) (max(x)+min(x))/2 max(x)]);
title('论文中常用的标准3点式显示')
x=20:10:20000;
y=rand(size(x));
subplot(3,2,6)
semilogx(x,y);
set(gca,'XLim',[20 20000]);
set(gca,'XMinorTick','off');
set(gca,'XTick',[20 31.5 63 125 250 500 1000 2000 4000 8000 16000]);
set(gca,'XGrid','on');
set(gca,'XMinorGrid','off');
title('自定义网格显示')
2.用gtext,这个最简单了。自己help gtext即可。
gtext('在这加上你要的标题,可以点哪里放哪里,在figure里面')
3.Matlab subplot之后在中央上方加标题 subtitle
摘自:http://hi.baidu.com/curbzz/blog/item/3732505afc963b94800a1895.html
很常用的问题,准备好好考虑下
以前都是用text随便搞的
考虑方法
step1、 找到第一行几个子图的位置,确定title位置
step2、在该位置新建一个坐标轴,添加title并隐藏坐标轴
如下
使用说明:
ht:title的句柄,如果需要修改字体大小颜色等可以引用
kn:subplot的列数
text: 需要添加的标题
======================================
function ht = subtitle(kn,text)
h1 = get(gcf,'children');
axis1 = get(h1(end),'Position');
axis2 = get(h1(end-kn+1),'Position');
axest = [axis1(1),axis1(2)+axis1(4),axis2(1)+axis1(3)-axis1(1),0.01];
ht = axes('Position',axest);
axis(ht,'off')
title(ht,text)
==========================
把上述内容保存为subtitle.m 文件,放到toolbox 或者当前文件夹下运行即可。
注意事项:前几天绘图时发现,如果每个subplot上还绘制了colorbar,那么这个colorbar也要算在kn里
比如3行2列,每个图都有colorbar,那么就要kn写4,这样才能保证文字在最中间。
先绘制subplot,都画完之后,再使用subtitle命令 ht = subtitle(4,'make the title in middle top')
4.附带subplot的用法
摘自,http://blog.sina.com.cn/s/blog_5fef8a5a0100duzf.html
写成subplot(m,n,p)或者subplot(mnp)。
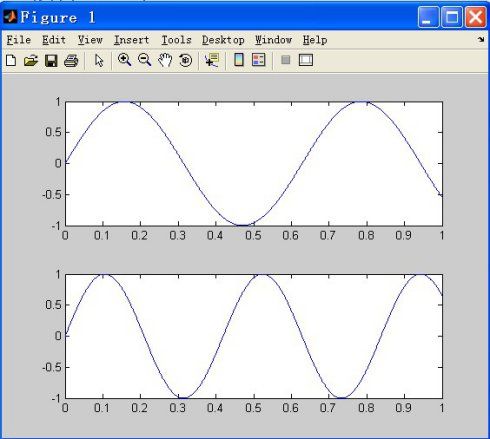
subplot是将多个图画到一个平面上的工具。其中,m表示是图排成m行,n表示图排成n列,也就是整个figure中有n个图是排成一行的,一共m行,如果第一个数字是2就是表示2行图。p是指你现在要把曲线画到figure中哪个图上,最后一个如果是1表示是从左到右第一个位置。下面是两个例子,可加深理解,
>> t=0:0.001:1;
>> y1=sin(10*t);
>> y2=sin(15*t);
>> subplot(211)
>> plot(t,y1)
>> subplot(212)
>> plot(t,y2)
出来的结果为:
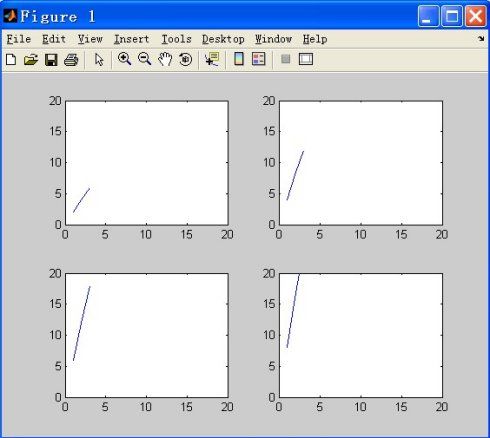
x1=[1 2 3];x2=x1;x3=x2;x4=x1;
y1=[2 4 6];y2=2*y1;y3=3*y1;y4=4*y1;
subplot(2,2,1)
plot(x1,y1);
axis([0,20,0,20])
subplot(2,2,2)
plot(x2,y2);
axis([0,20,0,20])
subplot(2,2,3)
plot(x3,y3)
axis([0,20,0,20])
subplot(2,2,4)
plot(x4,y4)
axis([0,20,0,20])

