使用Js和H5绘制流程图
主要使用的项目
dagre-d3 | 详细文档
简化一下官方的一个demo为我所用
其中依赖的两个Js文件
https://d3js.org/d3.v4.min.js
https://dagrejs.github.io/project/dagre-d3/latest/dagre-d3.js
<meta charset="utf-8">
<title>Dagre D3 Demo: Sentence Tokenizationtitle>

<script src="/js/d3.v4.min.js" charset="utf-8">script>
<script src="/js/dagre-d3.min.js">script>

<style id="css">
    /* This sets the color for "TK" nodes to a light blue green. */
    g.type-TK > rect {
        fill: #00ffd0;
    }

    text {
        font-weight: 300;
        font-family: "Helvetica Neue", Helvetica, Arial, sans-serf;
        font-size: 14px;
    }

    .node rect {
        stroke: #999;
        fill: #fff;
        stroke-width: 1.5px;
    }

    .edgePath path {
        stroke: #333;
        stroke-width: 1.5px;
    }
style>

<svg id="svg-canvas" width=960 height=600>svg>

<script >

  // Create the input graph
  var g = new dagreD3.graphlib.Graph()
    .setGraph({})
    .setDefaultEdgeLabel(function() { return {}; });

  // Here we"re setting nodeclass, which is used by our custom drawNodes function
  // below.
  g.setNode(0,  { label: "TOP",       class: "type-no" });
  g.setNode(1,  { label: "S",         class: "type-S" });
  g.setNode(2,  { label: "NP",        class: "type-NP" });
  g.setNode(3,  { label: "DT",        class: "type-DT" });
  g.setNode(4,  { label: "This",      class: "type-TK" });
  g.setNode(5,  { label: "VP",        class: "type-VP" });
  g.setNode(6,  { label: "VBZ",       class: "type-VBZ" });
  g.setNode(7,  { label: "is",        class: "type-TK" });
  g.setNode(8,  { label: "NP",        class: "type-NP" });
  g.setNode(9,  { label: "DT",        class: "type-DT" });
  g.setNode(10, { label: "an",        class: "type-TK" });
  g.setNode(11, { label: "NN",        class: "type-NN" });
  g.setNode(12, { label: "example",   class: "type-TK" });
  g.setNode(13, { label: ".",         class: "type-." });
  g.setNode(14, { label: "sentence",  class: "type-TK" });

  g.nodes().forEach(function(v) {
    var node = g.node(v);
    // Round the corners of the nodes
    node.rx = node.ry = 5;
  });

  // Set up edges, no special attributes.
  g.setEdge(3, 4);
  g.setEdge(2, 3);
  g.setEdge(1, 2);
  g.setEdge(6, 7);
  g.setEdge(5, 6);
  g.setEdge(9, 10);
  g.setEdge(8, 9);
  g.setEdge(11,12);
  g.setEdge(8, 11);
  g.setEdge(5, 8);
  g.setEdge(1, 5);
  g.setEdge(13,14);
  g.setEdge(1, 13);
  g.setEdge(0, 1);

  // Create the renderer
  var render = new dagreD3.render();

  // Set up an SVG group so that we can translate the final graph.
  var svg = d3.select("svg"),
    svgGroup = svg.append("g");

  // Run the renderer. This is what draws the final graph.
  render(d3.select("svg g"), g);

  // Center the graph
  var xCenterOffset = (svg.attr("width") - g.graph().width) / 2;
  svgGroup.attr("transform", "translate(" + xCenterOffset + ", 20)");
  svg.attr("height", g.graph().height + 40);
script>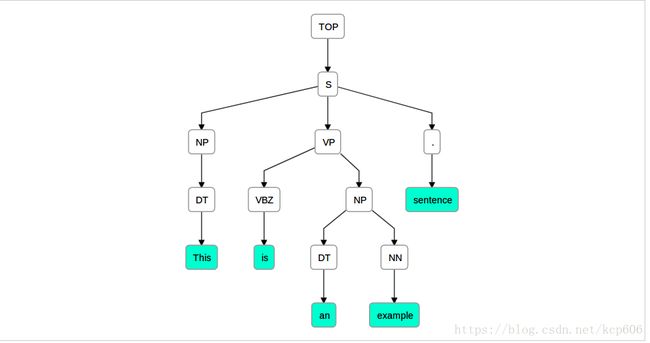
- 该项目的demo很直接, 只需要添加Node, 然后添加每个节点的上下连接关系即可修改为自己的流程图
- 个人改造 Github源码地址
