R语言与数据可视化-180705
2018.7.5作业
一、对文件的一些基本操作
1、对文件iris.csv中的数据进行一些简单的操作:
查看数据记得大小结构,维度,名称,属性
dim(iris)
names(iris)
str(iris)
查看数据前几行和后几行
iris[1:5,]head(iris)
tail(iris)
#可以查找某一列的值
iris[1:10,"Sepal.Length"]
iris$Sepal.Length[1:10]
结果:
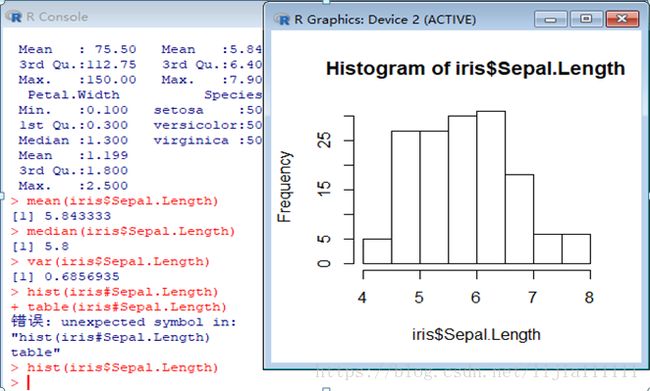
summary(iris)mean(iris$Sepal.Length)
median(iris$Sepal.Length)
结果如下:
#查看方差,绘制直方图
var(iris$Sepal.Length)
hist(iris$Sepal.Length)
二、绘制统计图和点图
一、  对读者reader.txt进行分析:
1、  共多少读者
reader <- read.table(file = "f:/data/reader.txt", header=T, sep = "\t", quote = "",comment.char = "", stringsAsFactors =F)
#共多少读者
readerTotal <- nrow(reader)
readerTotal
结果如下:
2、  读者的不同身份
#不同地方读者的身份workplace_desc
workplace <-unique(reader$workplace_desc)
head(workplace)
结果如下:
3、  不同读者的数量
#不同读者的数量
workplaceNum <- length(workplace)
workplaceNum
4、  # 不同读者的编码有几种
readercode<-unique(reader$reader_barcode)
head(readercode)
readercode <- length(readercode)
readercode
三、 对book.txt文件中内容进行分析:
1、  #书名信息展示title
titleStat <- table(book$title)
titleStat
N <- 10
titleTopN <- sort(titleStat, decreasing = T)[1:N]
titleTopN
titleFrame <- as.data.frame(titleTopN)
names(titleFrame) <- c("bookName", "Num")
library(ggplot2)
#条形图
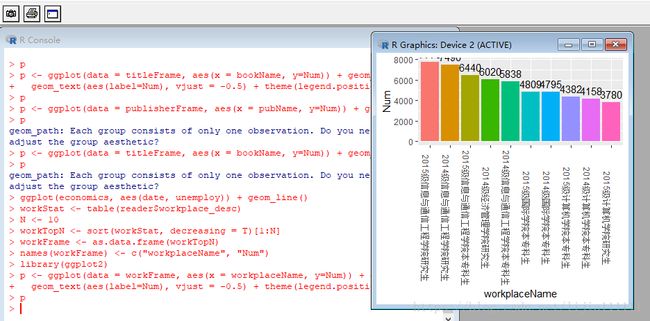
p <- ggplot(data = titleFrame, aes(x = bookName, y=Num)) + geom_col(aes(fill=bookName)) +
  geom_text(aes(label=Num), vjust = -0.5) + theme(legend.position = "none", axis.text.x = element_text( angle = 270))
p
#点图
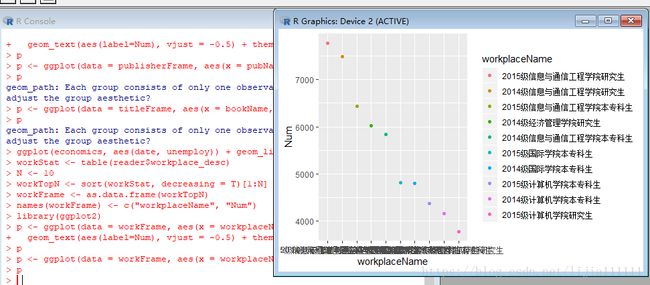
p <- ggplot(data = titleFrame, aes(x = bookName, y=Num)) + geom_point(aes(color=bookName))
p
条形图如下:
2、  同理可求出:读者信息排行榜展示
#读者排行榜展示workplace_desc  reader.txt
workStat <- table(reader$workplace_desc)
N <- 10
workTopN <- sort(workStat, decreasing = T)[1:N]
workFrame <- as.data.frame(workTopN)
names(workFrame) <- c("workplaceName", "Num")
library(ggplot2)
#条形图
p <- ggplot(data = workFrame, aes(x = workplaceName, y=Num)) + geom_col(aes(fill=workplaceName)) +
  geom_text(aes(label=Num), vjust = -0.5) + theme(legend.position = "none", axis.text.x = element_text( angle = 270))
p
#点图
p <- ggplot(data = workFrame, aes(x = bookName, y=Num)) + geom_point(aes(color=workplaceName))
p
三、 对borrow13.txt进行处理
求出借书日期与还书日期:
#图书借阅时间
#借书时间
checkdate1 <-unique(borrow13$date_checkout)
head(checkdate)
## 使用substring来提取借书时间
checkdate2= substring(checkdate1,1,10)
#还书时间
duedate1 <-unique(borrow13$date_due)
head(duedate)
# 使用substring来提取还书时间
duedate2= substring(duedate1,1,10)
还书日期如下:
得到借书日期与还书信息,后续可以对借书天数进行处理。


