ELK+Kafka搭建日志系统(单机版)、ESAPM追踪链系统
文章目录
- ELK+Kafka搭建分布式日志系统、ESAPM追踪链系统
- 软件安装
- zookeeper-3.6.0 假集群模式
- Kafka 安装(单机版)
- 将软件的数据进行串联
- 日志系统的数据流
- 追踪链的数据流
ELK+Kafka搭建分布式日志系统、ESAPM追踪链系统
系统配置
查看linux服务器信息
[root@linux-node2 ~]# cat /etc/redhat-release
CentOS Linux release 7.5.1804 (Core)
[root@linux-node2 ~]# uname -r
2.6.32-573.el6.x86_64
涉及组件
Elasticsearch-7.5.1
Logstash-7.5.1
Kibana-7.5.1
Filebeat-7.5.1
zookeeper-3.6.0
Kafka_2.13-2.4.0
Tomcat8.x
Jdk 8.x
软件安装
Elasticsearch-7.6.1:
https://blog.csdn.net/linpxing1/article/details/105871992
非root用户启动
[es@linux-node2 ~] es9200/bin/./elasticsearch -d
Logstash-7.6.1:
https://blog.csdn.net/linpxing1/article/details/105872104
https://blog.csdn.net/linpxing1/article/details/105872748
非root用户启动
[es@linux-node2 ~]#  su es
[es@linux-node2 ~]# nohup ./bin/logstash -f in_or_output_cfg/bee.conf > logs/logstash.log 2>&1 &
Filebeat-7.6.1:
https://blog.csdn.net/linpxing1/article/details/105872791
非root用户启动
[es@linux-node2 ~]# nohup ./filebeat -c filebeat.yml -e > logs/filebeat.log 2>&1 &
zookeeper-3.6.0 假集群模式
1,分别copy 解压好的目录 成三份
drwxr-xr-x  8 es   es         155 3月  11 09:52 zookeeper2181
drwxr-xr-x  8 es   es         147 3月  11 09:50 zookeeper2182
drwxr-xr-x  8 es   es         147 3月  11 09:50 zookeeper2183
2,修改配置文件
vim zookeeper2181/conf/zoo.cfg
tickTime=2000
dataDir=/app/soft/zookeeper2181/data
dataLogDir=/app/soft/zookeeper2181/logs
clientPort=2181

initLimit=5
syncLimit=2
server.1=192.168.9.93:2888:3888
server.2=192.168.9.93:4888:5888
server.3=192.168.9.93:6888:7888
vim zookeeper2181/data/myid
1
:wq
vim zookeeper2182/conf/zoo.cfg
tickTime=2000
dataDir=/app/soft/zookeeper2182/data
dataLogDir=/app/soft/zookeeper2182/logs
clientPort=2182

initLimit=5
syncLimit=2
server.1=192.168.9.93:2888:3888
server.2=192.168.9.93:4888:5888
server.3=192.168.9.93:6888:7888
配置myid zookeeper选举时使用
vim zookeeper2182/data/myid
2
:wq
vim zookeeper2183/conf/zoo.cfg
tickTime=2000
dataDir=/app/soft/zookeeper2183/data
dataLogDir=/app/soft/zookeeper2183/logs
clientPort=2183

initLimit=5
syncLimit=2
server.1=192.168.9.93:2888:3888
server.2=192.168.9.93:4888:5888
server.3=192.168.9.93:6888:7888
vim zookeeper2183/data/myid
3
:wq
切换成非root用户
依次启动
zookeeper2181/bin/zkServer.sh start
zookeeper2182/bin/zkServer.sh start
zookeeper2183/bin/zkServer.sh start
查看集群状态:
zookeeper2181/bin/zkServer.sh status
zookeeper2182/bin/zkServer.sh status
zookeeper2181/bin/zkServer.sh status
jps查看进程
[es@w102 soft]$ jps
22982 QuorumPeerMain
23047 QuorumPeerMain
23131 QuorumPeerMain
zookeeper 进程有,flower leader flower 则说明正常启动!
Kafka 安装(单机版)
kafka可以通过官网下载:https://kafka.apache.org/downloads
kafka根据Scala版本不同,又分为多个版本,我不需要使用Scala,所以就下载官方推荐版本kafka_2.13-2.4.0.tgz
解压文件
为文件创建 软链接 ln -s kafka_2.13-2.4.0 kafka
配置kafka的配置文件
vim config/server.properties
############################# Server Basics #############################

# The id of the broker. This must be set to a unique integer for each broker.
broker.id=0

############################# Socket Server Settings #############################

# The address the socket server listens on. It will get the value returned from
# java.net.InetAddress.getCanonicalHostName() if not configured.
#   FORMAT:
#     listeners = listener_name://host_name:port
#   EXAMPLE:
#     listeners = PLAINTEXT://your.host.name:9092
#listeners=PLAINTEXT://192.168.9.93:9092

# Hostname and port the broker will advertise to producers and consumers. If not set,
# it uses the value for "listeners" if configured.  Otherwise, it will use the value
# returned from java.net.InetAddress.getCanonicalHostName().
advertised.listeners=PLAINTEXT://kafka93:9092

# Maps listener names to security protocols, the default is for them to be the same. See the config documentation for more details
#listener.security.protocol.map=PLAINTEXT:PLAINTEXT,SSL:SSL,SASL_PLAINTEXT:SASL_PLAINTEXT,SASL_SSL:SASL_SSL

# The number of threads that the server uses for receiving requests from the network and sending responses to the network
num.network.threads=3

# The number of threads that the server uses for processing requests, which may include disk I/O
num.io.threads=8

# The send buffer (SO_SNDBUF) used by the socket server
socket.send.buffer.bytes=102400

# The receive buffer (SO_RCVBUF) used by the socket server
socket.receive.buffer.bytes=102400

# The maximum size of a request that the socket server will accept (protection against OOM)
socket.request.max.bytes=104857600


############################# Log Basics #############################

# A comma separated list of directories under which to store log files
log.dirs=/app/soft/kafka/logs

# The default number of log partitions per topic. More partitions allow greater
# parallelism for consumption, but this will also result in more files across
# the brokers.
num.partitions=3

# The number of threads per data directory to be used for log recovery at startup and flushing at shutdown.
# This value is recommended to be increased for installations with data dirs located in RAID array.
num.recovery.threads.per.data.dir=1

############################# Internal Topic Settings  #############################
# The replication factor for the group metadata internal topics "__consumer_offsets" and "__transaction_state"
# For anything other than development testing, a value greater than 1 is recommended to ensure availability such as 3.
offsets.topic.replication.factor=1
transaction.state.log.replication.factor=1
transaction.state.log.min.isr=1

############################# Log Flush Policy #############################

# Messages are immediately written to the filesystem but by default we only fsync() to sync
# the OS cache lazily. The following configurations control the flush of data to disk.
# There are a few important trade-offs here:
#    1. Durability: Unflushed data may be lost if you are not using replication.
#    2. Latency: Very large flush intervals may lead to latency spikes when the flush does occur as there will be a lot of data to flush.
#    3. Throughput: The flush is generally the most expensive operation, and a small flush interval may lead to excessive seeks.
# The settings below allow one to configure the flush policy to flush data after a period of time or
# every N messages (or both). This can be done globally and overridden on a per-topic basis.

# The number of messages to accept before forcing a flush of data to disk
#log.flush.interval.messages=10000

# The maximum amount of time a message can sit in a log before we force a flush
#log.flush.interval.ms=1000

############################# Log Retention Policy #############################

# The following configurations control the disposal of log segments. The policy can
# be set to delete segments after a period of time, or after a given size has accumulated.
# A segment will be deleted whenever *either* of these criteria are met. Deletion always happens
# from the end of the log.

# The minimum age of a log file to be eligible for deletion due to age
log.retention.hours=168

# A size-based retention policy for logs. Segments are pruned from the log unless the remaining
# segments drop below log.retention.bytes. Functions independently of log.retention.hours.
#log.retention.bytes=1073741824

# The maximum size of a log segment file. When this size is reached a new log segment will be created.
log.segment.bytes=1073741824

# The interval at which log segments are checked to see if they can be deleted according
# to the retention policies
log.retention.check.interval.ms=300000

############################# Zookeeper #############################

# Zookeeper connection string (see zookeeper docs for details).
# This is a comma separated host:port pairs, each corresponding to a zk
# server. e.g. "127.0.0.1:3000,127.0.0.1:3001,127.0.0.1:3002".
# You can also append an optional chroot string to the urls to specify the
# root directory for all kafka znodes.
zookeeper.connect=192.168.9.93:2181,192.168.9.93:2182,192.168.9.93:2183
#zookeeper.connect=192.168.9.93:2181
# Timeout in ms for connecting to zookeeper
zookeeper.connection.timeout.ms=6000


############################# Group Coordinator Settings #############################

# The following configuration specifies the time, in milliseconds, that the GroupCoordinator will delay the initial consumer rebalance.
# The rebalance will be further delayed by the value of group.initial.rebalance.delay.ms as new members join the group, up to a maximum of max.poll.interval.ms.
# The default value for this is 3 seconds.
# We override this to 0 here as it makes for a better out-of-the-box experience for development and testing.
# However, in production environments the default value of 3 seconds is more suitable as this will help to avoid unnecessary, and potentially expensive, rebalances during application startup.
group.initial.rebalance.delay.ms=0

# The largest record batch size allowed by Kafka.
message.max.bytes=100000000
重要的配置
broker.id是kafka broker的编号,集群里每个broker的id需不同。从0开始
listeners是监听地址,需要提供外网服务的话,要设置本地的IP地址
广播监听地址
advertised.listeners
Zookeeper连接配置
num.partitions 为新建Topic的默认Partition数量,partition数量提升,一定程度上可以提升并发性
启动脚本:
./bin/kafka-server-start.sh -daemon config/server.properties 后台启动
查看topic list:
bin/kafka-topics.sh --list --zookeeper kafka93:2181,kafka93:2182,kafka93:2183
创建生产组:
bin/kafka-console-producer.sh --broker-list kafka93:9092 --topic beelogs 回车后为要发送的内容
创建消费组:
bin/kafka-console-consumer.sh --bootstrap-server kafka93:9092 --consumer-property group.id=test_kafka_bee-g --topic beelogs
查看队列阻塞情况(前提是有消费组):
bin/kafka-topics.sh --zookeeper kafka93:2181,kafka93:2182,kafka93:2183 --describe --topic beelogs
删除主题
bin/kafka-topics.sh --zookeeper kafka93:2181,kafka93:2182,kafka93:2183 --delete --topic beelogs
注:到此所有要安装的软件已经安装好,现在要做的是将之串联起来,形成正确的数据流
将软件的数据进行串联
日志系统的数据流
logfile > monitor > filebeat > kafka > logstash > elasticsearch > kibana
filebeat.yml
#=========================== Filebeat inputs =============================
filebeat.inputs:
# Each - is an input. Most options can be set at the input level, so
# you can use different inputs for various configurations.
# Below are the input specific configurations.
- type: log
  # Change to true to enable this input configuration.
  enabled: true
  # Paths that should be crawled and fetched. Glob based paths.
  paths:
    - /app/fileRoot_base/logs/*/*.txt
    - /app/fileRoot_base/logs/*/framework/*.txt
    #- c:\programdata\elasticsearch\logs\*
  # Exclude lines. A list of regular expressions to match. It drops the lines that are
  # matching any regular expression from the list.
  #exclude_lines: ['^DBG']

  # Include lines. A list of regular expressions to match. It exports the lines that are
  # matching any regular expression from the list.
  #include_lines: ['^ERR', '^WARN']

  # Exclude files. A list of regular expressions to match. Filebeat drops the files that
  # are matching any regular expression from the list. By default, no files are dropped.
  exclude_files: ['.gz$']

  # Optional additional fields. These fields can be freely picked
  # to add additional information to the crawled log files for filtering
  fields:
     from: beelogs
  #  level: debug
  #  review: 1

#============================= Filebeat modules ===============================

filebeat.config.modules:
  # Glob pattern for configuration loading
  path: ${path.config}/modules.d/*.yml

  # Set to true to enable config reloading
  reload.enabled: true

  # Period on which files under path should be checked for changes
  #reload.period: 10s

#==================== Elasticsearch template setting ==========================

setup.template.settings:
  index.number_of_shards: 1
  #index.codec: best_compression
  #_source.enabled: false

#================================ General =====================================

# The name of the shipper that publishes the network data. It can be used to group
# all the transactions sent by a single shipper in the web interface.
#name:

# The tags of the shipper are included in their own field with each
# transaction published.
#tags: ["service-X", "web-tier"]

# Optional fields that you can specify to add additional information to the
# output.
fields:
   servicename: kafa-queuefile
   log_topic: beelogs
   hostname: 82-test-filebeat

#------------------------------ Kafka output ----------------------------------

output.kafka:
  hosts: ["kafka93:9092"]
  topic: '%{[fields.log_topic]}'
  partition.round_robin:
    reachable_only: false
  required_acks: 1
  compression: gzip
  max_message_bytes: 1000000
  keep_alive: 10s
 # topics:
 #  - topic: "critical-%{[agent.version]}"
 #     when.contains:
 #       message: "CRITICAL"
 #   - topic: "error-%{[agent.version]}"
 #     when.contains:
 #       message: "ERR"

#================================ Processors =====================================

# Configure processors to enhance or manipulate events generated by the beat.

processors:
  - add_host_metadata: ~
  - add_cloud_metadata: ~
  - add_docker_metadata: ~
  - add_kubernetes_metadata: ~

#================================ Logging =====================================

# Sets log level. The default log level is info.
# Available log levels are: error, warning, info, debug
logging.level: debug

# At debug level, you can selectively enable logging only for some components.
# To enable all selectors use ["*"]. Examples of other selectors are "beat",
# "publish", "service".
logging.selectors: ["*"]

#================================= Migration ==================================

# This allows to enable 6.7 migration aliases
#migration.6_to_7.enabled: true
kafka作为接收中间的管子不需要再配置什么 topic没有会自动创建
logstash 配置
input {
kafka {
bootstrap_servers => "kafka93:9092" #kafka服务器地址
topics => "beelogs"
group_id => "beelog-filebeat"
decorate_events => true #kafka标记
consumer_threads => 1
codec => "json" #写入的时候使用json编码,因为logstash收集后会转换成json格式
}
}
filter {
grok {
match => ["message","(?[^\[\]]+) \[(?[^\[\]]+):(?[^\[\]]+)\] \[(?[^\[\]]+)\] \[(?[^\[\]]+)\] (?[A-Z]+) %{GREEDYDATA:msg}" ]
}
if ![rid] {
drop {}
}
date {
match => ["logtime", "yyyy-MM-dd HH:mm:ss.SSS"]
target => "@timestamp"
}
mutate {
replace => ["message", "%{msg}"]
remove_field => ["msg"]
}
}
output {
if [fields][log_topic] == "beelogs"{
elasticsearch {
hosts => ["192.168.9.93:9200"]
index => "bee-log-%{+YYYY.MM.dd}"
}
}
}
数据落袋结束
使用kibana创建自定义模板 bee-log* 因为es默认提供的模板存在缺陷,固作下微调
入口
配置一个生命周期策略待用:


index声明
{
  "index": {
    "lifecycle": {
      "name": "beelogs-rollover-180-days",
      "rollover_alias": "beelogs-180-days"
    },
    "codec": "best_compression",
    "mapping": {
      "total_fields": {
        "limit": "2000"
      }
    },
    "refresh_interval": "5s",
    "number_of_shards": "2",
    "query": {
      "default_field": [
        "message"
      ]
    },
    "number_of_routing_shards": "30",
    "number_of_replicas": "0"
  }
}
mapping申明
{
  "properties": {
    "agent": {
      "properties": {
        "hostname": {
          "type": "text",
          "fields": {
            "keyword": {
              "ignore_above": 256,
              "type": "keyword"
            }
          }
        },
        "id": {
          "type": "text",
          "fields": {
            "keyword": {
              "ignore_above": 256,
              "type": "keyword"
            }
          }
        },
        "ephemeral_id": {
          "type": "text",
          "fields": {
            "keyword": {
              "ignore_above": 256,
              "type": "keyword"
            }
          }
        },
        "type": {
          "type": "text",
          "fields": {
            "keyword": {
              "ignore_above": 256,
              "type": "keyword"
            }
          }
        },
        "version": {
          "type": "text",
          "fields": {
            "keyword": {
              "ignore_above": 256,
              "type": "keyword"
            }
          }
        }
      }
    },
    "method": {
      "type": "text",
      "fields": {
        "keyword": {
          "ignore_above": 256,
          "type": "keyword"
        }
      }
    },
    "log": {
      "properties": {
        "file": {
          "properties": {
            "path": {
              "type": "text",
              "fields": {
                "keyword": {
                  "ignore_above": 256,
                  "type": "keyword"
                }
              }
            }
          }
        },
        "offset": {
          "type": "long"
        }
      }
    },
    "tomcat": {
      "type": "text",
      "fields": {
        "keyword": {
          "ignore_above": 256,
          "type": "keyword"
        }
      }
    },
    "message": {
      "type": "text",
      "fields": {
        "keyword": {
          "ignore_above": 256,
          "type": "keyword"
        }
      }
    },
    "rid": {
      "type": "text",
      "fields": {
        "keyword": {
          "ignore_above": 256,
          "type": "keyword"
        }
      }
    },
    "type": {
      "type": "text",
      "fields": {
        "keyword": {
          "ignore_above": 256,
          "type": "keyword"
        }
      }
    },
    "tags": {
      "type": "text",
      "fields": {
        "keyword": {
          "ignore_above": 256,
          "type": "keyword"
        }
      }
    },
    "input": {
      "properties": {
        "type": {
          "type": "text",
          "fields": {
            "keyword": {
              "ignore_above": 256,
              "type": "keyword"
            }
          }
        }
      }
    },
    "hostname": {
      "type": "text",
      "fields": {
        "keyword": {
          "ignore_above": 256,
          "type": "keyword"
        }
      }
    },
    "@timestamp": {
      "type": "date"
    },
    "ecs": {
      "properties": {
        "version": {
          "type": "text",
          "fields": {
            "keyword": {
              "ignore_above": 256,
              "type": "keyword"
            }
          }
        }
      }
    },
    "@version": {
      "type": "text",
      "fields": {
        "keyword": {
          "ignore_above": 256,
          "type": "keyword"
        }
      }
    },
    "host": {
      "type": "text",
      "fields": {
        "keyword": {
          "ignore_above": 256,
          "type": "keyword"
        }
      }
    },
    "tranceid": {
      "type": "text",
      "fields": {
        "keyword": {
          "ignore_above": 256,
          "type": "keyword"
        }
      }
    },
    "leve": {
      "type": "text",
      "fields": {
        "keyword": {
          "ignore_above": 256,
          "type": "keyword"
        }
      }
    },
    "fields": {
      "properties": {
        "hostname": {
          "type": "text",
          "fields": {
            "keyword": {
              "ignore_above": 256,
              "type": "keyword"
            }
          }
        },
        "log_topic": {
          "type": "text",
          "fields": {
            "keyword": {
              "ignore_above": 256,
              "type": "keyword"
            }
          }
        },
        "from": {
          "type": "text",
          "fields": {
            "keyword": {
              "ignore_above": 256,
              "type": "keyword"
            }
          }
        },
        "servicename": {
          "type": "text",
          "fields": {
            "keyword": {
              "ignore_above": 256,
              "type": "keyword"
            }
          }
        }
      }
    },
    "logtime": {
      "type": "text",
      "fields": {
        "keyword": {
          "ignore_above": 256,
          "type": "keyword"
        }
      }
    }
  }
}
保存为自定义的模板,后这个通配符下的都默认会使用这个模板

有数据进来后,logs的组件下就会有数据,结合kibana的给到的各种字段查询、报表你就可以进行日志文件的统一汇总

追踪链的数据流
java agent client > http > apm-server > kafka > logstash > elasticsearch > kibana
agent配置:
相关文档目录:
配置参数指引:
https://www.elastic.co/guide/en/apm/agent/java/1.x/configuration.html
核心参数:
https://www.elastic.co/guide/en/apm/agent/java/1.x/config-core.html
apm的开销及性能调优:
https://www.elastic.co/guide/en/apm/agent/java/1.x/tuning-and-overhead.html
Elastic APM 版本对应代理版本的支持
https://www.elastic.co/guide/en/apm/get-started/7.6/agent-server-compatibility.html
手动配置参数:
https://www.elastic.co/guide/en/apm/agent/java/1.x/setup-javaagent.html
tomcat 集成参数配置
文件目录: tomcat-x/bin/setnev.sh
##setnev.sh
## apm-agent 代理jar包路径
export CATALINA_OPTS="$CATALINA_OPTS -javaagent:/app/iParkCloudBase/liwei_use/agent/apm-server/elastic-apm-agent-1.15.0.jar"
## apm 服务名称 对应kibana后台的apm服务列表下的名称
export CATALINA_OPTS="$CATALINA_OPTS -Delastic.apm.service_name=82-apm-test-8001"
##默认值 拦截入口
export CATALINA_OPTS="$CATALINA_OPTS -Delastic.apm.application_packages=org.example,org.another.example"
##apm数据上报的服务端的地址
export CATALINA_OPTS="$CATALINA_OPTS -Delastic.apm.server_urls=http://192.168.9.93:8200"
## jvm对应的apm的服务名称
export CATALINA_OPTS="$CATALINA_OPTS -Delastic.apm.service_node_name=192.168.9.82-8001"
## 主机名称配置
export CATALINA_OPTS="$CATALINA_OPTS -Delastic.apm.hostname=9.82:8001"
## agent日志等级
export CATALINA_OPTS="$CATALINA_OPTS -Delastic.apm.log_level=debug"
## agent日志的文件位置
export CATALINA_OPTS="$CATALINA_OPTS -Delastic.apm.log_file=_AGENT_HOME_/logs/8001-elastic-apm.log"
## log4j log4j2 logback 集成
##export CATALINA_OPTS="$CATALINA_OPTS -Delastic.apm.enable_log_correlation=true"
apm-server.yml配置
######################### APM Server Configuration #########################

################################ APM Server ################################

apm-server:
  # Defines the host and port the server is listening on. Use "unix:/path/to.sock" to listen on a unix domain socket.
  host: "192.168.9.93:8200"

  kibana:
    # For APM Agent configuration in Kibana, enabled must be true.
    enabled: true
    host: "192.168.9.93:5601"

  ilm:
    enabled: "auto"
    setup:
      enabled: true
      mapping:
        - event_type: "error"
          policy_name: "apm-rollover-30-days"
        - event_type: "span"
          policy_name: "apm-rollover-30-days"
        - event_type: "transaction"
          policy_name: "apm-rollover-30-days"
        - event_type: "metric"
          policy_name: "apm-rollover-30-days"
      policies:
        - name: "apm-rollover-30-days"
          policy:
            phases:
              hot:
                actions:
                  rollover:
                    max_size: "50gb"
                    max_age: "30d"
                  set_priority:
                    priority: 100
              warm:
                min_age: "30d"
                actions:
                  set_priority:
                    priority: 50
                  readonly: {}

#================================= Template =================================

# A template is used to set the mapping in Elasticsearch.
# By default template loading is enabled and the template is loaded.
# These settings can be adjusted to load your own template or overwrite existing ones.

# Set to false to disable template loading.
setup.template.enabled: true

# Template name. By default the template name is "apm-%{[observer.version]}"
# The template name and pattern has to be set in case the elasticsearch index pattern is modified.
setup.template.name: "apm-%{[observer.version]}"

# Template pattern. By default the template pattern is "apm-%{[observer.version]}-*" to apply to the default index settings.
# The first part is the version of apm-server and then -* is used to match all daily indices.
# The template name and pattern has to be set in case the elasticsearch index pattern is modified.
setup.template.pattern: "apm-%{[observer.version]}-*"

# Path to fields.yml file to generate the template.
setup.template.fields: "${path.config}/fields.yml"

# Overwrite existing template.
setup.template.overwrite: true

# Elasticsearch template settings.
setup.template.settings:

  # A dictionary of settings to place into the settings.index dictionary
  # of the Elasticsearch template. For more details, please check
  # https://www.elastic.co/guide/en/elasticsearch/reference/current/mapping.html
  index:
    number_of_shards: 2
    number_of_replicas: 0
    codec: best_compression
    number_of_routing_shards: 30
    mapping.total_fields.limit: 2000


#------------------------------ Kafka output ------------------------------
output.kafka:
  # Boolean flag to enable or disable the output module.
  enabled: true

  # The list of Kafka broker addresses from where to fetch the cluster metadata.
  # The cluster metadata contain the actual Kafka brokers events are published
  # to.
  hosts: ["kafka93:9092"]

  # The Kafka topic used for produced events. The setting can be a format string
  # using any event field. To set the topic from document type use `%{[type]}`.
  topic: apmlogs

  keep_alive: 30


  client_id: apm-beats

#================================= Paths ==================================

# The home path for the apm-server installation. This is the default base path
# for all other path settings and for miscellaneous files that come with the
# distribution.
# If not set by a CLI flag or in the configuration file, the default for the
# home path is the location of the binary.
path.home: /app/soft/apm-server

# The configuration path for the apm-server installation. This is the default
# base path for configuration files, including the main YAML configuration file
# and the Elasticsearch template file. If not set by a CLI flag or in the
# configuration file, the default for the configuration path is the home path.
path.config: ${path.home}

# The data path for the apm-server installation. This is the default base path
# for all the files in which apm-server needs to store its data. If not set by a
# CLI flag or in the configuration file, the default for the data path is a data
# subdirectory inside the home path.
path.data: ${path.home}/data

# The logs path for an apm-server installation. If not set by a CLI flag or in the
# configuration file, the default is a logs subdirectory inside the home path.
path.logs: ${path.home}/logs

#================================= Logging =================================

# There are three options for the log output: syslog, file, and stderr.
# Windows systems default to file output. All other systems default to syslog.

# Sets the minimum log level. The default log level is info.
# Available log levels are: error, warning, info, or debug.
logging.level: info

# Enable debug output for selected components. To enable all selectors use ["*"].
# Other available selectors are "beat", "publish", or "service".
# Multiple selectors can be chained.
logging.selectors: ["*"]

# Send all logging output to syslog. The default is false.
logging.to_syslog: false
logging.to_files: true
logging.files:
  # Configure the path where the logs are written. The default is the logs directory
  # under the home path (the binary location).
  path: /app/soft/apm-server/logs/

  # The name of the files where the logs are written to.
  name: apm-server.log

  # Configure log file size limit. If limit is reached, log file will be
  # automatically rotated.
  rotateeverybytes: 10485760 # = 10MB

  # Number of rotated log files to keep. Oldest files will be deleted first.
  keepfiles: 7

  # The permissions mask to apply when rotating log files. The default value is 0600.
  # Must be a valid Unix-style file permissions mask expressed in octal notation.
  permissions: 0644

  # Enable log file rotation on time intervals in addition to size-based rotation.
  # Intervals must be at least 1s. Values of 1m, 1h, 24h, 7*24h, 30*24h, and 365*24h
  # are boundary-aligned with minutes, hours, days, weeks, months, and years as
  # reported by the local system clock. All other intervals are calculated from the
  # Unix epoch. Defaults to disabled.
  interval: 24h

# Set to true to log messages in json format.
#logging.json: false
kafka作为数据管道,没有要配置的
logstash加载配置文件
二合一 (日志系统+追踪链)
## 输入配置
input {
kafka {
bootstrap_servers => "kafka93:9092" #kafka服务器地址
topics => "beelogs"
group_id => "beelog-filebeat"
decorate_events => true # kafka标记
consumer_threads => 1
type => "beelogs"
client_id => "filebeat-7.6" ## 注意不指定clent_id会报错,因为使用有多个kafka的consumer client
codec => "json" #写入的时候使用json编码,因为logstash收集后会转换成json格式
}
kafka {
bootstrap_servers => "kafka93:9092" #kafka服务器地址
topics => "apmlogs"
group_id => "beelog-apm"
decorate_events => true # kafka标记
consumer_threads => 1
type => "apmlogs"
client_id => "apm-7.6"
codec => "json" #写入的时候使用json编码,因为logstash收集后会转换成json格式
}
}
## 过滤插件
filter {
if [type] == "beelogs"{
grok {
match => ["message","(?[^\[\]]+) \[(?[^\[\]]+):(?[^\[\]]+)\] \[(?[^\[\]]+)\] \[(?[^\[\]]+)\] (?[A-Z]+) %{GREEDYDATA:msg}" ]
}
if ![rid] {
drop {}
}
date {
match => ["logtime", "yyyy-MM-dd HH:mm:ss.SSS"]
target => "@timestamp"
}
mutate {
replace => ["message", "%{msg}"]
remove_field => ["msg"]
}
}
}
##输出到 elasticsearch配置
output {
if [type] == "beelogs"{
elasticsearch {
hosts => ["kafka93:9200"]
index => "bee-log-%{+YYYY.MM.dd}"
}
}
if[type] == "apmlogs"{
if[processor][event] == "span" {
elasticsearch {
hosts => ["kafka93:9200"]
index => "apm-%{[observer][version]}-span-%{+yyyy.MM.dd}"
}
}else if [processor][event] == "sourcemap" {
elasticsearch {
hosts => ["kafka93:9200"]
index => "apm-%{[observer][version]}-sourcemap-%{+yyyy.MM.dd}"
}
}else if [processor][event] == "error" {
elasticsearch {
hosts => ["kafka93:9200"]
index => "apm-%{[observer][version]}-error-%{+yyyy.MM.dd}"
}
}else if [processor][event] == "transaction" {
elasticsearch {
hosts => ["kafka93:9200"]
index => "apm-%{[observer][version]}-transaction-%{+yyyy.MM.dd}"
}
}else if [processor][event] == "metric" {
elasticsearch {
hosts => ["kafka93:9200"]
index => "apm-%{[observer][version]}-metric-%{+yyyy.MM.dd}"
}
}else if [processor][event] == "onboarding" {
elasticsearch {
hosts => ["kafka93:9200"]
index => "apm-%{[observer][version]}-onboarding-%{+yyyy.MM.dd}"
}
}else{
elasticsearch {
hosts => ["kafka93:9200"]
index => "apm-%{[observer][version]}-%{+yyyy.MM.dd}"
}
}
}
}
数据的配置基本结束
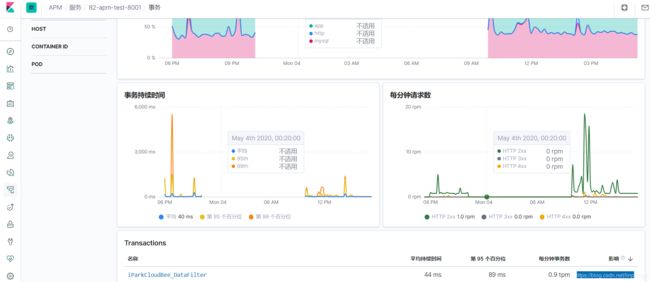
最后的效果