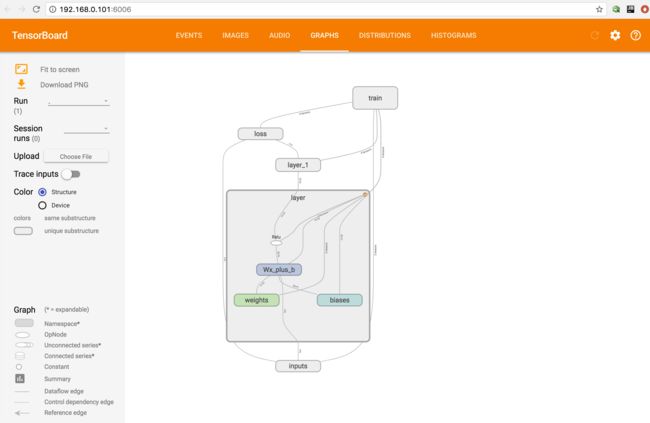
目标:利用终端实现一个简单的神经网络示意图
硬件工具:Mac
软件工具:tensorflow
创建py文件
这是一个小型的神经网络,输入--》隐层1 --》 隐层2 --》输出
import tensorflow as tf

#create layer
def add_layer(inputs, in_size, out_size, activation_function=None):
    # add one more layer and return the output of this layer
    #this is label
    with tf.name_scope('layer'):
        with tf.name_scope('weights'):
            Weights = tf.Variable(
            tf.random_normal([in_size, out_size]),
            name='W')
        with tf.name_scope('biases'):
            biases = tf.Variable(
            tf.zeros([1, out_size]) + 0.1,
            name='b')
        with tf.name_scope('Wx_plus_b'):
            Wx_plus_b = tf.add(
            tf.matmul(inputs, Weights),
            biases)
        if activation_function is None:
            outputs = Wx_plus_b
        else:
            outputs = activation_function(Wx_plus_b, )
        return outputs

# x ,y placeholder
with tf.name_scope('inputs'):
        xs= tf.placeholder(tf.float32, [None, 1],name='x_in')
        ys= tf.placeholder(tf.float32, [None, 1],name='y_in')

#layer
l1 = add_layer(xs,1,10,activation_function=tf.nn.relu)

#prediction
prediction = add_layer(l1,10,1,activation_function=None)

#loss to measure model
with tf.name_scope('loss'):
    loss = tf.reduce_mean(
    tf.reduce_sum(
    tf.square(ys - prediction),
    reduction_indices=[1]
    ))

#train
with tf.name_scope('train'):
    train_step =  tf.train.GradientDescentOptimizer(0.1).minimize(loss)

# start run ,first create session
sess = tf.Session()
#create a file in the logs document
writer = tf.train.SummaryWriter("logs/",sess.graph)

# this isimportant
sess.run(tf.initialize_all_variables())
运行python,接着使用terminal中cd定位log所在的文件位置,输入
python -m tensorflow.tensorboard --logdir=logs
终端会出现
图片中的 http://192.168.0.101:6006
此时就能在图片中查看生成的小型神经网络结构图啦
另外一般会在event中生成loss图像,在distributions展示图标中 histograms展示权重和偏值与输出值的直方图
需要对代码进行相应的添加显示语句
import tensorflow as tf
import numpy as np

def add_layer(inputs, in_size, out_size, n_layer,activation_function=None):
    # add one more layer and return the output of this layer
    layer_name = 'layer%s'%n_layer
    with tf.name_scope(layer_name):
        with tf.name_scope('weights'):
            Weights = tf.Variable(
            tf.random_normal([in_size, out_size]),
            name='W')
            tf.histogram_summary(layer_name+'/weights',Weights)
        with tf.name_scope('biases'):
            biases = tf.Variable(
            tf.zeros([1, out_size]) + 0.1,
            name='b')
            tf.histogram_summary(layer_name+'/biases',biases)
        with tf.name_scope('Wx_plus_b'):
            Wx_plus_b = tf.add(
            tf.matmul(inputs, Weights),
            biases)
        if activation_function is None:
            outputs = Wx_plus_b
        else:
            outputs = activation_function(Wx_plus_b, )
            tf.histogram_summary(layer_name+'/outputs',outputs)
        return outputs

# make up some real data
#numpy.linspace(start,stop,num = 50,endpoint = True,retstep = False,dtype = None)
x_data = np.linspace(-1,1,300)[:,np.newaxis] #从-1 ~1 列上添加一个维度
noise = np.random.normal(0,0.05,x_data.shape)
y_data = np.square(x_data) - 0.5 +noise

with tf.name_scope('inputs'):
    xs= tf.placeholder(tf.float32, [None, 1],name='x_in')
    ys= tf.placeholder(tf.float32, [None, 1],name='y_in')

l1 = add_layer(xs,1,10,n_layer=1,activation_function=tf.nn.relu)
prediction = add_layer(l1,10,1,n_layer=2,activation_function=None)

with tf.name_scope('loss'):
    loss = tf.reduce_mean(
    tf.reduce_sum(
    tf.square(ys - prediction),
    reduction_indices=[1]
    ))
    tf.scalar_summary('loss',loss)

with tf.name_scope('train'):
    train_step = tf.train.GradientDescentOptimizer(0.1).minimize(loss)

sess = tf.Session()
merged = tf.merge_all_summaries()
writer = tf.train.SummaryWriter("logs/",sess.graph)

sess.run(tf.initialize_all_variables())

for i in range(1000):
    sess.run(train_step,feed_dict={xs:x_data,ys:y_data})
    if i%50 == 0:
        result = sess.run(merged,feed_dict={xs:x_data,ys:y_data})
        writer.add_summary(result,i)
图形如下


