基于Python的绘图与可视化
简单介绍matplotlib
是一个2D的绘图包,他还有很多插件工具集,用于3D图形的mplot3d以及用于地图和投影的basemap
import matplotlib.pyplot as plt
from numpy.random import randn
import pandas as pd
from pandas import DataFrame,Series
import numpy as np
1、基本绘图
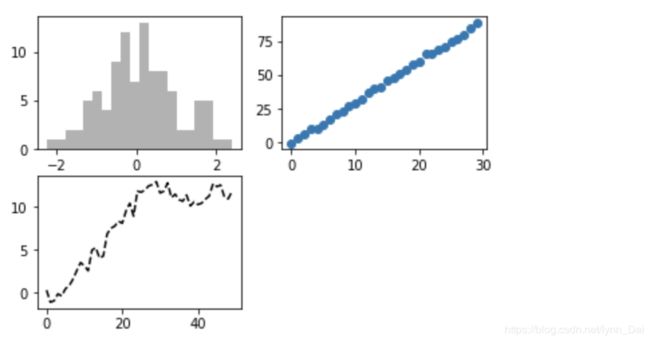
fig = plt.figure()
ax1 = fig.add_subplot(2,2,1)
ax2 = fig.add_subplot(2,2,2)
ax3 = fig.add_subplot(2,2,3)
ax3.plot(randn(50).cumsum(),'k--')
## 柱状图
ax1.hist(randn(100),bins=20,color='k',alpha=0.3)
## 散点图
ax2.scatter(np.arange(30),np.arange(30)*3+randn(30))
plt.show()
subplot可以创建一个新的figure。并返回一个含有一创建的subplot对象的numpy数组
fig,axes = plt.subplots(2,3)
调整subplot周围的间距,wspace,hspace 用来控制宽度和高度的百分比
## 主要参数
### subplots_adjust(left=None,bottom=None,right=None,top=None,wspace=None,hspace=None)
fig1 = plt.figure()
fig1,axes = plt.subplots(2,2,sharex=True,sharey=True)
for i in range(2):
    for j in range(2):
        axes[i,j].hist(randn(500),bins=50,color='k',alpha=0.5)
plt.subplots_adjust(wspace=0,hspace=0)
plt.show()
2、设置轴标签、刻度和刻度标签
fig = plt.figure()
ax = fig.add_subplot(1,1,1)
ax.plot(randn(1000).cumsum())
设置刻度宽度
ticks = ax.set_xticks([0,250,500,750,1000])
设置刻度标签
labels = ax.set_xticklabels(['one','two','three','four','five'],rotation=30,fontsize='small')
ax.set_xlabel('Stages')
plt.show()
3、注解
ax.text(x,y,'hello world',family='monospace',fontsize=10)
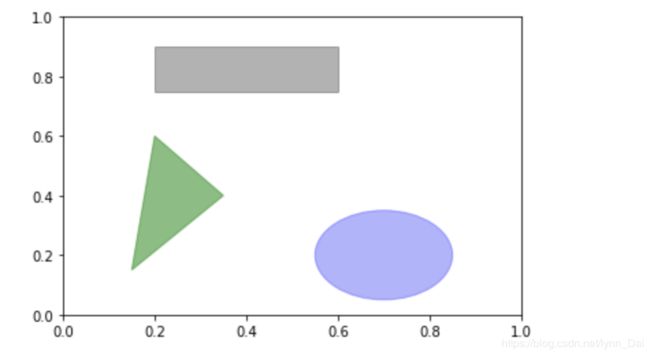
要在图表中添加一个图形,需要创建一个块对象shp
fig=plt.figure()
ax = fig.add_subplot(1,1,1)
rect=plt.Rectangle((0.2,0.75),0.4,0.15,color='k',alpha=0.3)
circ=plt.Circle((0.7,0.2),0.15,color='b',alpha=0.3)
pgon=plt.Polygon([[0.15,0.15],[0.35,0.4],[0.2,0.6]],color='g',alpha=0.5)
ax.add_patch(rect)
ax.add_patch(circ)
ax.add_patch(pgon)
plt.show()
4、将图表保存到文件
fig.savefig('re-ci-pg.png')
5、matplotlib配置
将全局管理图像大小、subplot边距、配色方案、字体大小、网络类型
- 通过python编程方式,将全局的图像默认大小设置为10*10
plt.rc('figure',figsize=(10,10))
font_option = {'family':'monospace',
               'weight':'bold',
               'size':'small'}
plt.rc('font',**font_option)
可以配置文件matplotlibrc位于matplotlib/mpl-data目录中,并将其放在自己的matplotlibrc目录中
6、线型图
s=Series(np.random.rand(10).cumsum(),index=np.arange(0,100,10))
s.plot()
plt.show()
df=DataFrame(np.random.rand(10,4).cumsum(0),columns=['A','B','C','D'],index=np.arange(0,100,10))
df.plot()
plt.show()
7、柱状图
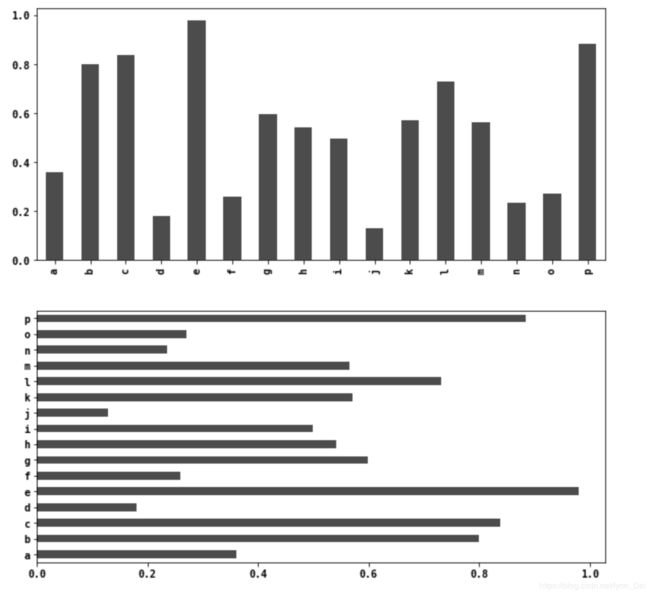
kind='bar'表示垂直柱状图,kind='barh'表示水平柱状图,Series和DataFrame的索引会被用来做X或Y
fig,axes = plt.subplots(2,1)
data=Series(np.random.rand(16),index=list('abcdefghijklmnop'))
data.plot(kind='bar',ax=axes[0],color='k',alpha=0.7)
data.plot(kind='barh',ax=axes[1],color='k',alpha=0.7)
plt.show()
- 对于
DataFrame
df = DataFrame(np.random.rand(6,4),index=['one','two','three','four','five','six'],
               columns=pd.Index(['A','B','C','D'],name='Genus'))
df
Out:
Genus	A	B	C	D
one	0.170127	0.006826	0.906227	0.627840
two	0.425502	0.668585	0.800707	0.477013
three	0.784296	0.983987	0.318071	0.966247
four	0.822363	0.227549	0.203001	0.233771
five	0.532559	0.616758	0.233564	0.988166
six	0.534776	0.426271	0.331994	0.974694
stacked=True表示生成堆积柱状图
df.plot(kind='bar',stacked=True,alpha=0.5)
plt.show()


