从pdf中提取图中曲线(和数据点)的方法(papa的儿子)
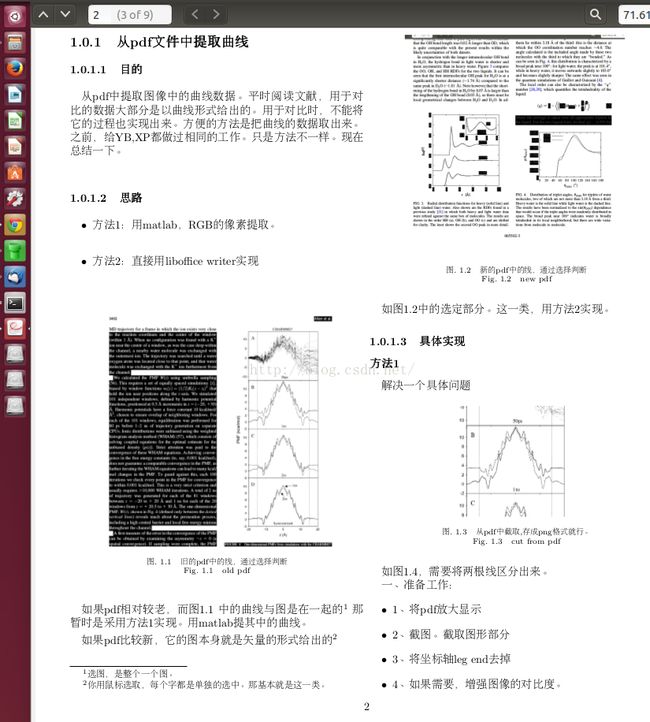
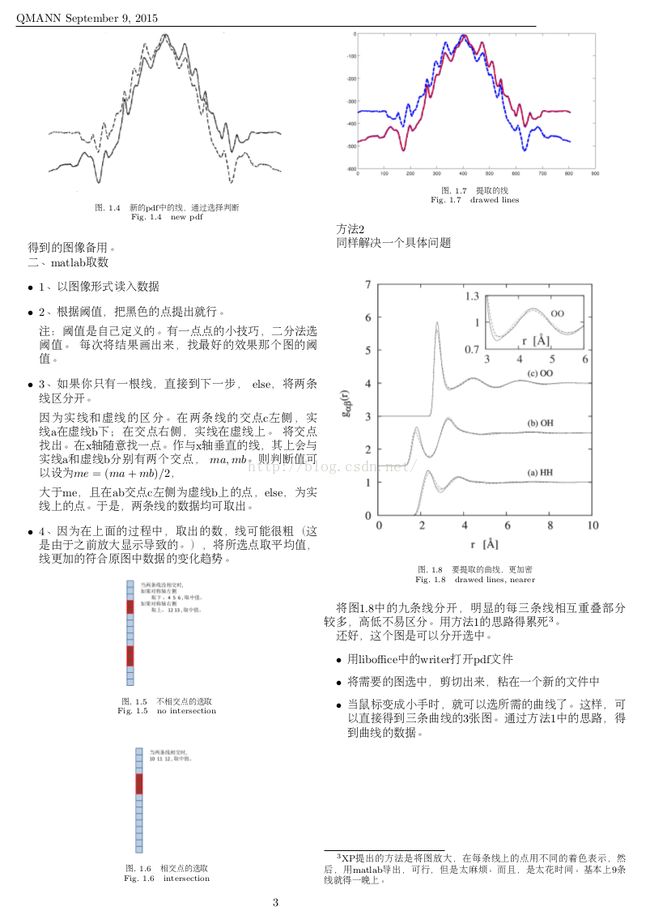
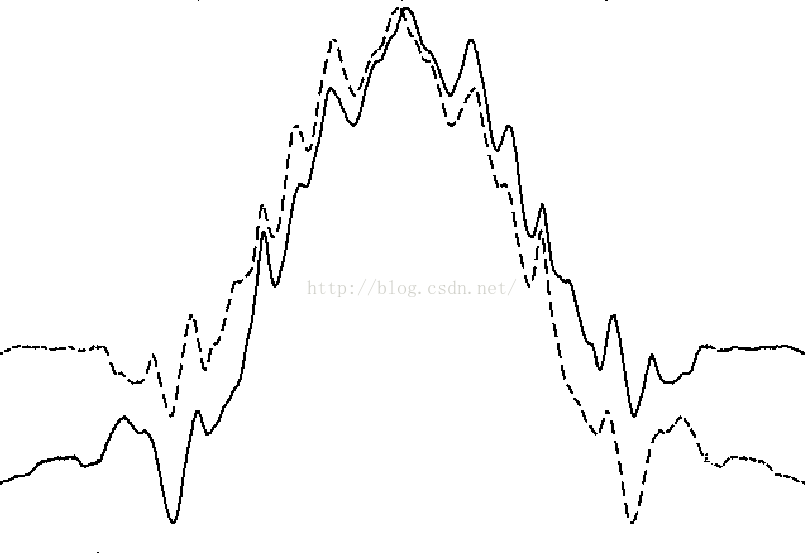
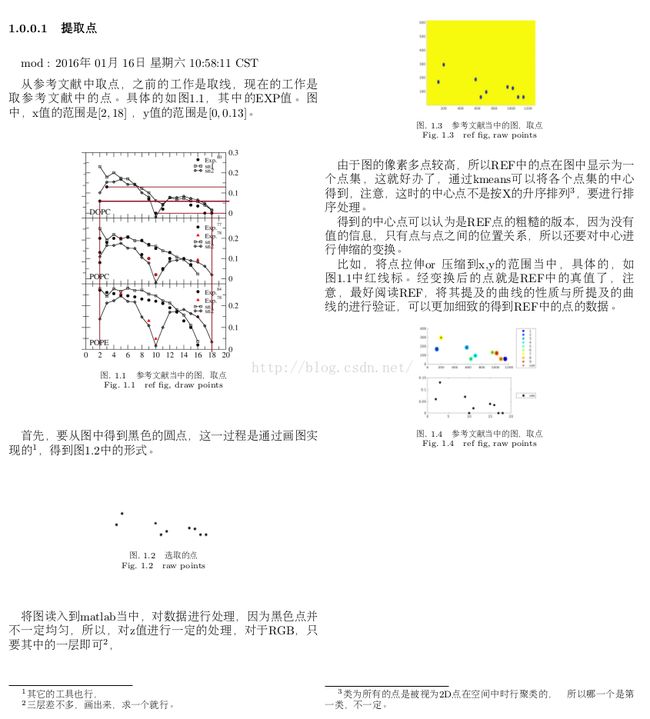
因为懒,把文档的内容用图片的形式给出。附件扔matlab程序。
work_draw_line.m
clear all
clc
clf

%% outline
% draw XP lines


%% main
a=imread('../data/lines.png');
dat_r=a(:,:,1);
dat_g=a(:,:,2);
dat_b=a(:,:,3);

thred =100;

ind_r=(double(dat_r)
fun_4XP_draw_point.m
function [ ind ] = fun_4XP_draw_point( input , flg_ud)

%UNTITLED2 Summary of this function goes here
%   Detailed explanation goes here

ind_tm=find(input == 1) ;
ma = max(ind_tm);
mi = min(ind_tm);

if (ma - mi) ~= length(ind_tm)
    thred_mean = (ma + mi)/2;

    if flg_ud ==1
        tm = ind_tm(ind_tm > thred_mean);
    else
        tm = ind_tm(ind_tm < thred_mean);
    end
else
    tm =ind_tm;
end

ind = mean(tm);
右更新:
现在要提REF中图的点的数据。
过程和思路如下图。
clear all
clc
clf


%% %%%%%%%%%%%%%%%%%%%%%%%%%%%%%%
% outline
% draw real value line from fig, all


%% %%%%%%%%%%%%%%%%%%%%%%%%%%%%%%%%%%
% main


% read imgs files ---------------------------------------
dat=imread('../data/ref_real_dopc/scd/ref_scd_exp.png');


% pre deal imgs -----------------------------------------
tm=flipud(dat(:,:,2));
ind=tm>50;


% size image
[m,n]=size(tm);


% gen x,y index
[X,Y]=meshgrid([1:n],[1:m]);


% plot data, choose the thre -----------------------------
surf(X,Y,tm,'edgecolor','none')
view(0,90)
axis tight


% delete the useless points -----------------------------
X(ind)=[];
Y(ind)=[];
tm(ind)=[];
% generate data point sets ------------------------------
poi=[X(:)';Y(:)']';


% kmeans to find the data set centers -------------------
[ind_all,cen_noord]=kmeans(poi,9);


% sort centers
cen=sortrows(cen_noord);


% transform y -------------------------------------------
y_tar_max=0.13;
y_tar_min=0;


y_li_max=max(cen(:,2));
y_li_min=min(cen(:,2));
y_val_final=(y_tar_max-y_tar_min)*(cen(:,2)-y_li_min)./(y_li_max-y_li_min)+y_tar_min;


% transform x
x_tar_max=18;
x_tar_min=2;


x_li_max=max(cen(:,1));
x_li_min=min(cen(:,1));
x_val_final=(x_tar_max-x_tar_min)*(cen(:,1)-x_li_min)./(x_li_max-x_li_min)+x_tar_min;


% plot each groups ----------------------------------------
col_mm=jet(9);
subplot(2,1,1)
hold on
for i=1:9
    ind=ind_all==i;
    plot(X(ind),Y(ind),'o','markeredgecolor',col_mm(i,:),'markerfacecolor',col_mm(i,:))
    leg_str{i}=mat2str(i);
end
plot(cen(:,1),cen(:,2),'k*')


leg_str{10}='cen';
legend(leg_str,'location','eastoutside')


% plot the transfored data -----------------------------
subplot(2,1,2)
plot(x_val_final,y_val_final,'ko','markerfacecolor','k')
legend('cen','location','eastoutside')


