内容简介
- pyecharts的应用
- 绘制树图
- 绘制矩形树图
- 绘制散点图矩阵
- 绘制地图,标出销售数据
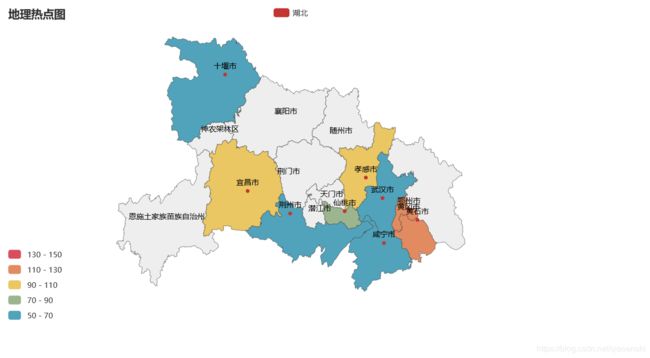
- 绘制地理热点图
- 绘制词云图
- 绘制主题河流图
pyecharts的应用
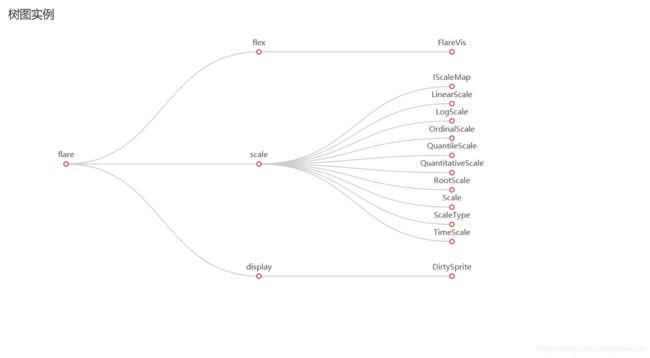
绘制树图
from pyecharts.charts import Tree, TreeMap
import pyecharts.options as opts
from pyecharts.globals import ThemeType
import json
with open('lianxi.json', 'r', encoding='utf-8') as json_file:
data = json.load(json_file)
print(data)
tree = (
Tree(init_opts=opts.InitOpts(theme=ThemeType.SHINE, width="800px", height="500px"))
.add("", data, is_roam=False)
.set_global_opts(title_opts=opts.TitleOpts('树图实例'))
.set_series_opts(label_opts=opts.LabelOpts(is_show=True))
.render('树图.html')
)
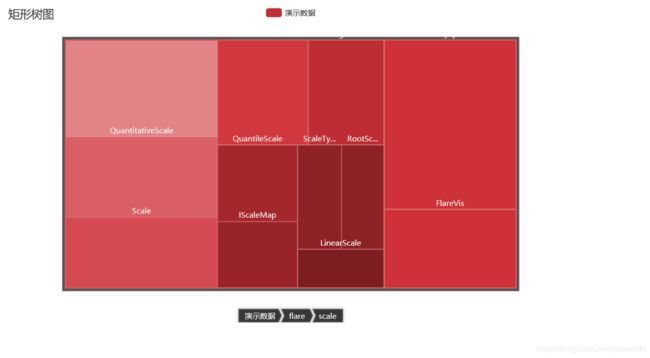
绘制矩形树图
from pyecharts.charts import Tree, TreeMap
import pyecharts.options as opts
from pyecharts.globals import ThemeType
import json
with open('lianxi.json', 'r', encoding='utf-8') as json_file:
data = json.load(json_file)
print(data)
X = (
TreeMap(init_opts=opts.InitOpts(theme=ThemeType.SHINE))
.add(series_name="演示数据", data=data,
levels=[
opts.TreeMapLevelsOpts(
treemap_itemstyle_opts=opts.TreeMapItemStyleOpts(
border_color="#555", border_width=4, gap_width=4
)
),
opts.TreeMapLevelsOpts(
color_saturation=[0.3, 0.6],
treemap_itemstyle_opts=opts.TreeMapItemStyleOpts(
border_width=2, gap_width=2, border_color_saturation=0.6
)
),
opts.TreeMapLevelsOpts(
color_saturation=[0.3, 0.7],
treemap_itemstyle_opts=opts.TreeMapItemStyleOpts(
border_color_saturation=0.6, gap_width=1
)
),
opts.TreeMapLevelsOpts(
color_saturation= [0.3, 0.5]
)
],
)
.set_global_opts(title_opts=opts.TitleOpts(title="矩形树图"))
.set_series_opts(label_opts=opts.LabelOpts(is_show=True))
.render("矩形树图.html")
)
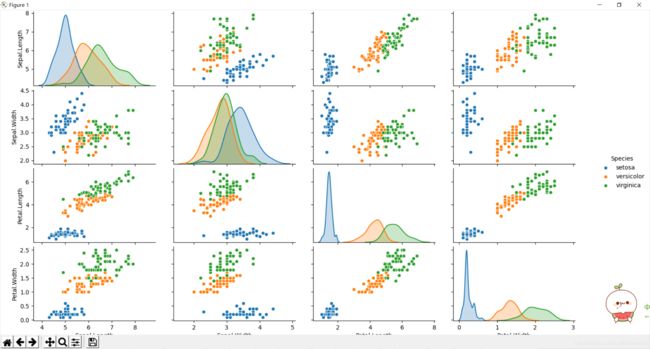
绘制散点图矩阵
import seaborn
import matplotlib.pyplot as plt
import pandas as pd
data = pd.read_csv('iris.csv')
print(data)
seaborn.pairplot(data=data, hue="Species", vars=['Sepal.Length', 'Sepal.Width', 'Petal.Length', 'Petal.Width'])
plt.show()
plt.savefig('p5.png')
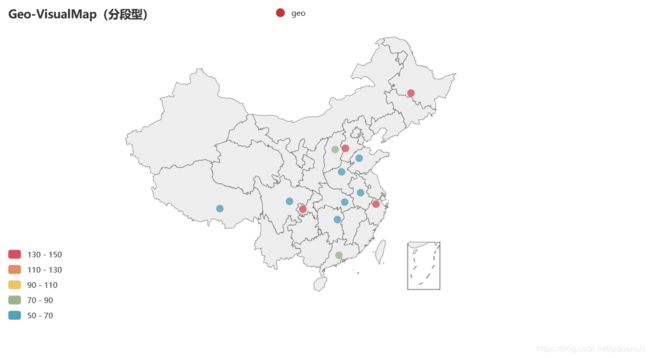
绘制地图,标出销售数据
import random
from pyecharts.charts import Map, Geo
import pyecharts.options as opts

province = ['广东', '湖北', '湖南', '四川', '重庆', '黑龙江', '浙江',
            '山西', '河北', '安徽', '河南', '山东', '西藏']
data = [(random.randint(50, 150)) for i in range(len(province))]
print(province)
print(data)

c = (
    Geo()
    .add_schema(maptype="china")
    .add("geo", [list(z) for z in zip(province, data)])
    .set_series_opts(label_opts=opts.LabelOpts(is_show=False))
    .set_global_opts(
        visualmap_opts=opts.VisualMapOpts(is_piecewise=True, max_=150, min_=50, type_='color'),
        title_opts=opts.TitleOpts(title="Geo-VisualMap(分段型)"),
    )
    .render("销售额显示图.html")
)
绘制地理热点图
import random
from pyecharts.charts import Map
import pyecharts.options as opts
cities = ['武汉市', '十堰市', '鄂州市', '宜昌市', '荆州市', '孝感市', '黄石市', '咸宁市', '仙桃市']


data = [(random.randint(50, 150)) for i in range(len(cities))]
print(data)
map = (
    Map()
    .add(series_name="湖北", data_pair=[list(z) for z in zip(cities, data)], maptype="湖北", is_map_symbol_show=True)
    .set_global_opts(tooltip_opts=opts.TooltipOpts(is_show=True), title_opts=opts.TitleOpts(title="地理热点图"),
                     visualmap_opts=opts.VisualMapOpts(max_=150))
    .set_series_opts(label_opts=opts.LabelOpts(is_show=True))
    .render("地理热点图.html")
)
绘制词云图
from pyecharts.charts import WordCloud
import pyecharts.options as opts
import pandas as pd
data = pd.read_csv('word_data.csv')
print(data)
A = data.iloc[:, 3]
B = data.iloc[:, 1]
C = data.iloc[:, 2]

wc = (
    WordCloud()
    .add(series_name="浏览量分析", data_pair=[list(z) for z in zip(A, B)], word_size_range=[26, 66])
    .add(series_name="评论量分析", data_pair=[list(z) for z in zip(A, C)], word_size_range=[26, 66])
    .set_global_opts(title_opts=opts.TitleOpts(title='浏览量', title_textstyle_opts=opts.TextStyleOpts(font_size=23)),
                     tooltip_opts=opts.TooltipOpts(is_show=True))
    .render('词云图.html')
)

绘制主题河流图
from pyecharts.charts import ThemeRiver
import pyecharts.options as opts

datax = ['分支1', '分支2', '分支3', '分支4', '分支5', '分支6']
datay = [
    ['2015/11/08', 10, '分支1'], ['2015/11/09', 15, '分支1'], ['2015/11/10', 35, '分支1'],
    ['2015/11/14', 7, '分支1'], ['2015/11/15', 2, '分支1'], ['2015/11/16', 17, '分支1'],
    ['2015/11/17', 33, '分支1'], ['2015/11/18', 40, '分支1'], ['2015/11/19', 32, '分支1'],
    ['2015/11/20', 26, '分支1'], ['2015/11/21', 35, '分支1'], ['2015/11/22', 40, '分支1'],
    ['2015/11/23', 32, '分支1'], ['2015/11/24', 26, '分支1'], ['2015/11/25', 22, '分支1'],
    ['2015/11/08', 35, '分支2'], ['2015/11/09', 36, '分支2'], ['2015/11/10', 37, '分支2'],
    ['2015/11/11', 22, '分支2'], ['2015/11/12', 24, '分支2'], ['2015/11/13', 26, '分支2'],
    ['2015/11/14', 34, '分支2'], ['2015/11/15', 21, '分支2'], ['2015/11/16', 18, '分支2'],
    ['2015/11/17', 45, '分支2'], ['2015/11/18', 32, '分支2'], ['2015/11/19', 35, '分支2'],
    ['2015/11/20', 30, '分支2'], ['2015/11/21', 28, '分支2'], ['2015/11/22', 27, '分支2'],
    ['2015/11/23', 26, '分支2'], ['2015/11/24', 15, '分支2'], ['2015/11/25', 30, '分支2'],
    ['2015/11/26', 35, '分支2'], ['2015/11/27', 42, '分支2'], ['2015/11/28', 42, '分支2'],
    ['2015/11/08', 21, '分支3'], ['2015/11/09', 25, '分支3'], ['2015/11/10', 27, '分支3'],
    ['2015/11/11', 23, '分支3'], ['2015/11/12', 24, '分支3'], ['2015/11/13', 21, '分支3'],
    ['2015/11/14', 35, '分支3'], ['2015/11/15', 39, '分支3'], ['2015/11/16', 40, '分支3'],
    ['2015/11/17', 36, '分支3'], ['2015/11/18', 33, '分支3'], ['2015/11/19', 43, '分支3'],
    ['2015/11/20', 40, '分支3'], ['2015/11/21', 34, '分支3'], ['2015/11/22', 28, '分支3'],
    ['2015/11/14', 7, '分支4'], ['2015/11/15', 2, '分支4'], ['2015/11/16', 17, '分支4'],
    ['2015/11/17', 33, '分支4'], ['2015/11/18', 40, '分支4'], ['2015/11/19', 32, '分支4'],
    ['2015/11/20', 26, '分支4'], ['2015/11/21', 35, '分支4'], ['2015/11/22', 40, '分支4'],
    ['2015/11/23', 32, '分支4'], ['2015/11/24', 26, '分支4'], ['2015/11/25', 22, '分支4'],
    ['2015/11/26', 16, '分支4'], ['2015/11/27', 22, '分支4'], ['2015/11/28', 10, '分支4'],
    ['2015/11/08', 10, '分支5'], ['2015/11/09', 15, '分支5'], ['2015/11/10', 35, '分支5'],
    ['2015/11/11', 38, '分支5'], ['2015/11/12', 22, '分支5'], ['2015/11/13', 16, '分支5'],
    ['2015/11/14', 7, '分支5'], ['2015/11/15', 2, '分支5'], ['2015/11/16', 17, '分支5'],
    ['2015/11/17', 33, '分支5'], ['2015/11/18', 40, '分支5'], ['2015/11/19', 32, '分支5'],
    ['2015/11/20', 26, '分支5'], ['2015/11/21', 35, '分支5'], ['2015/11/22', 4, '分支5'],
    ['2015/11/23', 32, '分支5'], ['2015/11/24', 26, '分支5'], ['2015/11/25', 22, '分支5'],
    ['2015/11/26', 16, '分支5'], ['2015/11/27', 22, '分支5'], ['2015/11/28', 10, '分支5'],
    ['2015/11/08', 10, '分支6'], ['2015/11/09', 15, '分支6'], ['2015/11/10', 35, '分支6'],
    ['2015/11/11', 38, '分支6'], ['2015/11/12', 22, '分支6'], ['2015/11/13', 16, '分支6'],
    ['2015/11/14', 7, '分支6'], ['2015/11/15', 2, '分支6'], ['2015/11/16', 17, '分支6'],
    ['2015/11/17', 33, '分支6'], ['2015/11/18', 4, '分支6'], ['2015/11/19', 32, '分支6'],
    ['2015/11/20', 26, '分支6'], ['2015/11/21', 35, '分支6'], ['2015/11/22', 40, '分支6'],
    ['2015/11/23', 32, '分支6'], ['2015/11/24', 26, '分支6'], ['2015/11/25', 22, '分支6']
]

river = (
    ThemeRiver(init_opts=opts.InitOpts(width="1600px", height="800px"))
    .add(series_name=datax, data=datay,
         singleaxis_opts=opts.SingleAxisOpts(pos_top="50",pos_bottom="50", type_="time"))
    .set_global_opts(tooltip_opts=opts.TooltipOpts(trigger="axis", axis_pointer_type="line"))
    .render("theme_river.html")
)
