python 之seaborn库的基础使用(5种常用图形的使用)
画图中,常用的图形有直方图、条形图、分类柱形图、散点图、盒图。(其实还有一个折线图,但是在写的时候发现,sns.lineplot、sns.ggplot这些函数一个都用不了,so,折线图就不说了)
一、直方图
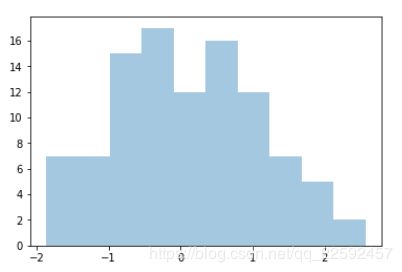
这个图形的作用,就是你输入一个单变量数据,它会告诉你这个数据集中数据的分布情况,并且你可以自定义划分为若干区间。
seaborn.distplot(a, bins=None, hist=True, kde=True, rug=False, fit=None, hist_kws=None, kde_kws=None, rug_kws=None, fit_kws=None, color=None, vertical=False, norm_hist=False, axlabel=None, label=None, ax=None)
a:数据来源
bins:矩形图数量
hist:是否显示直方图
kde:是否显示核函数估计图
rug:控制是否显示观察的边际毛毯
fit:控制拟合的参数分布图形
vertical:显示正交控制
import seaborn as sns
import numpy as np
import matplotlib as mpl
import matplotlib.pyplot as plt
%matplotlib inline

x = np.random.normal(size=100)#生成100个数
#print(x)
sns.distplot(x,kde=False,bins=10)
二、条形图
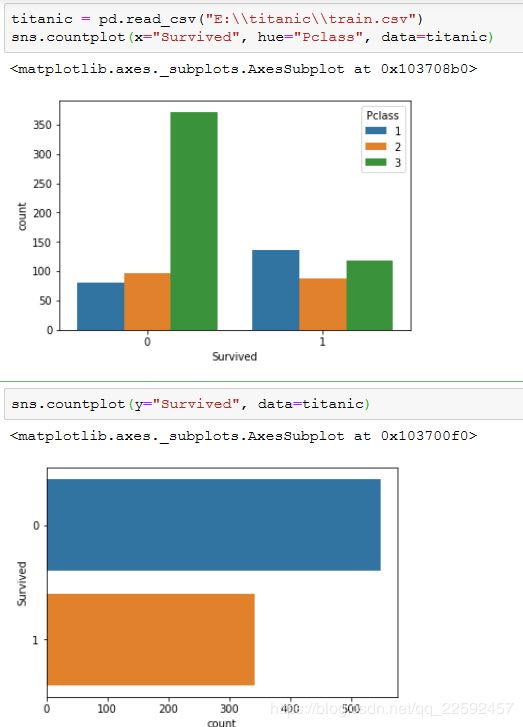
同样是对一个单变量数据进行处理,但是这里它会统计每一个不同值出现的次数,然后把值的大小作为横坐标,值出现的次数作为纵坐标画图。
seaborn.countplot(x=None, y=None, hue=None, data=None, order=None, hue_order=None, orient=None, color=None, palette=None, saturation=0.75, ax=None, **kwargs)
x,y:设置x,y,x为竖型图,y为横型图
hue:为数据分类
data:输入的数据集
order, hue_order:控制变量绘图的顺序
ax:设置子图位置
orient:"v"|"h",控制绘图的方向,水平或者竖直
palette:颜色选择
下面两个例子,体会一下hue参数的作用
titanic = pd.read_csv("E:\\titanic\\train.csv")
sns.countplot(x="Survived", hue="Pclass", data=titanic)

sns.countplot(y="Survived", data=titanic)
三、分类柱形图
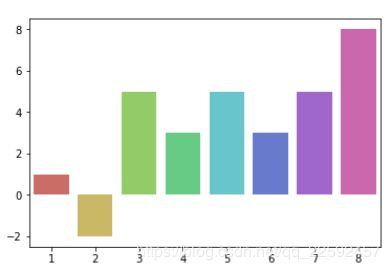
这里你要输入两个变量值x、y,x作为柱形图的横轴,y作为柱形图的高度。如我们现在有华南区各省份今年的gdp值,现在要画个柱形图体现,就要自定义一个x,gdp作为y值画图了。
seaborn.barplot(x=None, y=None, hue=None, data=None, order=None, hue_order=None,ci=95, n_boot=1000, units=None, orient=None, color=None, palette=None, saturation=0.75, errcolor='.26', errwidth=None, capsize=None, ax=None, estimator=
a = np.arange(1,9,1)
b = a + np.random.randint(-4,3,8)
#print(b)
sns.barplot(a,b,palette=sns.color_palette("hls", 8)) #matplotlib中用的是bar
四、散点图
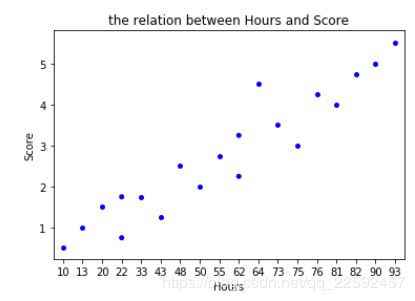
一般用来看看两个变量之间是否存在关系
stripplot(x=None, y=None, hue=None, data=None, order=None, hue_order=None, jitter=False, dodge=False, orient=None, color=None, palette=None, size=5, edgecolor='gray', linewidth=0, ax=None, **kwargs)
#创建数据集
examDict  = {'学习时间':[0.50,0.75,1.00,1.25,1.50,1.75,1.75,
                     2.00,2.25,2.50,2.75,3.00,3.25,3.50,4.00,4.25,4.50,4.75,5.00,5.50],
             '分数':[10,22,13,43,20,22,33,50,62,
                   48,55,75,62,73,81,76,64,82,90,93]}

#转换为DataFrame的数据格式
examDf = pd.DataFrame(examDict)

fig,ax = plt.subplots()
ax = sns.stripplot(examDf.分数,examDf.学习时间,color='b')
ax.set_xlabel('Hours')
ax.set_ylabel('Score')
ax.set_title('the relation between Hours and Score')
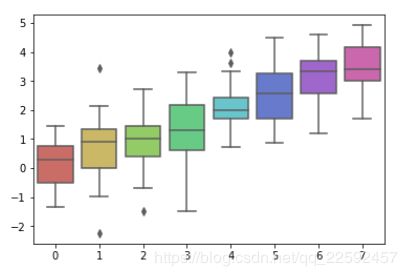
五、盒图
又称箱形图,它由五个数值点组成:最小值(min),下四分位数(Q1),中位数(median),上四分位数(Q3),最大值(max)。主要用作显示一组数据分散情况资料的统计图。
boxplot(x=None, y=None, hue=None, data=None, order=None, hue_order=None, orient=None, color=None, palette=None, saturation=0.75, width=0.8, dodge=True, fliersize=5, linewidth=None, whis=1.5, notch=False, ax=None, **kwargs)
data = np.random.normal(size=(20, 8)) + np.arange(8) / 2
sns.boxplot(data=data,palette=sns.color_palette("hls", 8))