Aerosol vertical distribution and optical properties over China from long-term satellite and ground-based remote sensing
Abstract. The seasonal and spatial variations of vertical distribution and optical properties of aerosols over China are studied using long-term satellite observations from the Cloud–Aerosol Lidar with Orthogonal Polarization (CALIOP) and ground-based lidar observations and Aerosol Robotic Network (AERONET) data. The CALIOP products are validated using the ground-based lidar measurements at the Semi-Arid Climate and Environment Observatory of Lanzhou University (SACOL). The Taklamakan Desert and Tibetan Plateau regions exhibit the highest depolarization and color ratios because of the natural dust origin, whereas the North China Plain, Sichuan Basin and Yangtze River Delta show the lowest depolarization and color ratios because of aerosols from secondary formation of the anthropogenic origin. Certain regions, such as the North China Plain in spring and the Loess Plateau in winter, show intermediate depolarization and color ratios because of mixed dust and anthropogenic aerosols. In the Pearl River Delta region, the depolarization and color ratios are similar to but higher than those of the other polluted regions because of combined anthropogenic and marine aerosols. Long-range transport of dust in the middle and upper troposphere in spring is well captured by the CALIOP observations. The seasonal variations in the aerosol vertical distributions reveal efficient transport of aerosols from the atmospheric boundary layer to the free troposphere because of summertime convective mixing. The aerosol extinction lapse rates in autumn and winter are more positive than those in spring and summer, indicating trapped aerosols within the boundary layer because of stabler meteorological conditions. More than 80% of the column aerosols are distributed within 1.5km above the ground in winter, when the aerosol extinction lapse rate exhibits a maximum seasonal average in all study regions except for the Tibetan Plateau. The aerosol extinction lapse rates in the polluted regions are higher than those of the less polluted regions, indicating a stabilized atmosphere due to absorptive aerosols in the polluted regions. Our results reveal that the satellite and ground-based remote-sensing measurements provide the key information on the long-term seasonal and spatial variations in the aerosol vertical distribution and optical properties, regional aerosol types, long-range transport and atmospheric stability, which can be utilized to more precisely assess the direct and indirect aerosol effects on weather and climate.
**How to cite: **Tian, P., Cao, X., Zhang, L., Sun, N., Sun, L., Logan, T., Shi, J., Wang, Y., Ji, Y., Lin, Y., Huang, Z., Zhou, T., Shi, Y., and Zhang, R.: Aerosol vertical distribution and optical properties over China from long-term satellite and ground-based remote sensing, Atmos. Chem. Phys., 17, 2509-2523, https://doi.org/10.5194/acp-17-2509-2017, 2017.
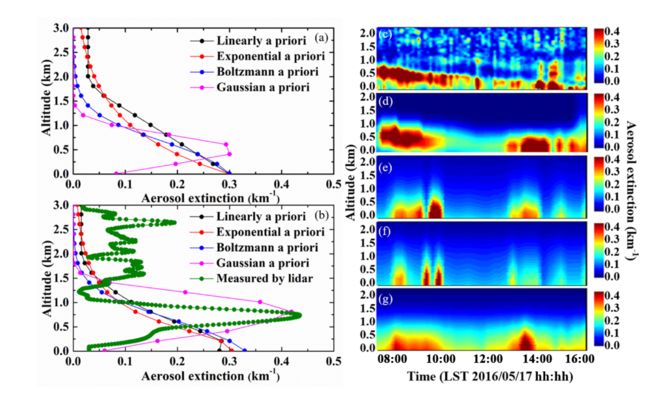
Measurements of aerosol layer height and vertical profiles by lidar over Jinhua City
Author Affiliations +
Proceedings Volume 10710, Young Scientists Forum 2017; 107101Z (2018) https://doi.org/10.1117/12.2317595
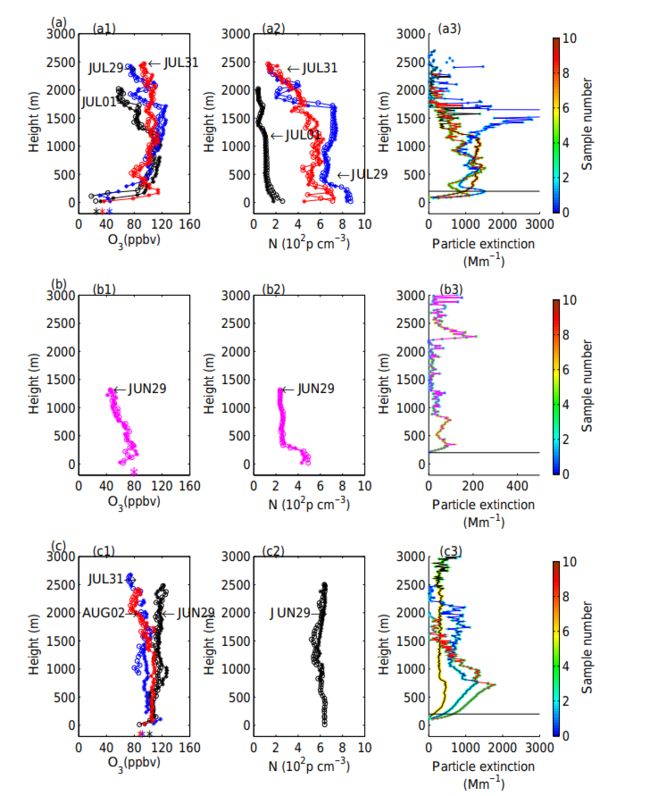
Observations of the vertical distributions of summertime
atmospheric pollutants and the corresponding ozone
production in Shanghai, China
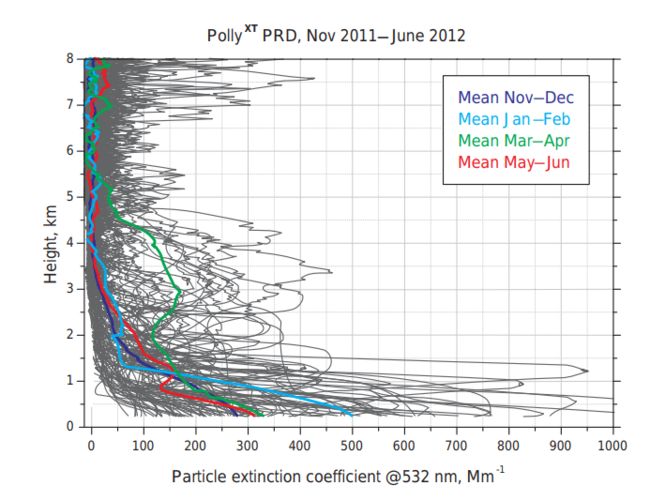
Continuous vertical aerosol profiling with a multi-wavelength
Raman polarization lidar over the Pearl River Delta, China
Statistical Comparison of Cloud and Aerosol Vertical Properties between Two Eastern China Regions Based on CloudSat/CALIPSO Data
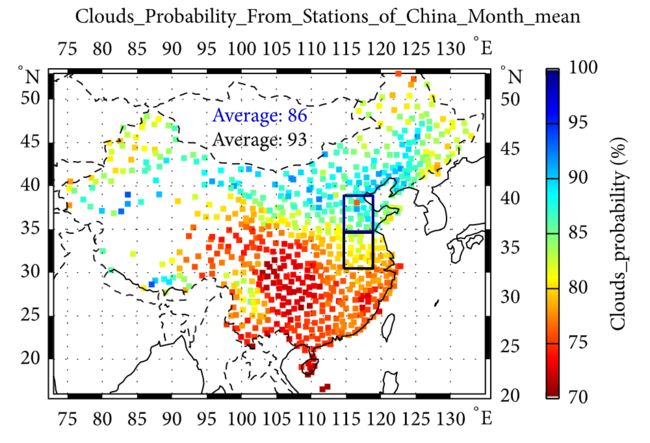
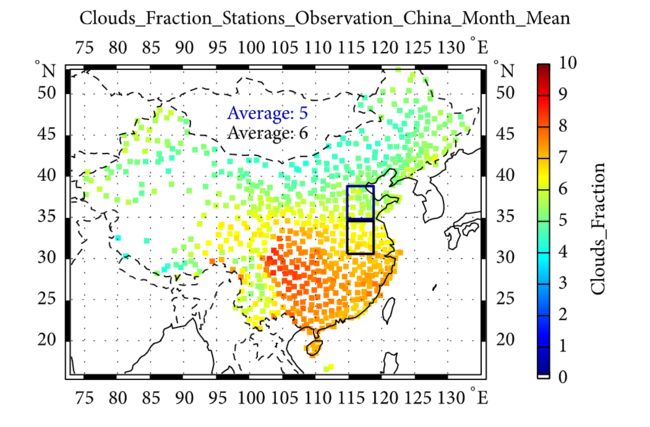
Figure 1: Distributions of monthly mean values of cloud occurrence frequencies and cloud covers observed by the ground observation station. The top rectangular zone represents Region 2 and the bottom one represents Region 1.