导入模块
import pandas as pd
import matplotlib.pyplot as plt
import matplotlib as mpl
import numpy as np

mpl.rcParams['font.sans-serif'] = ['SimHei']
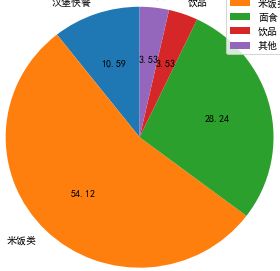
饼图
def pie_plot(object_obj,col_name='占比'):
    series = pd.Series(object_obj[col_name].values,
                       index=object_obj.index)
    series.plot.pie(figsize=(6, 6),
                    labeldistance = 1.1,
                    autopct='%.2f',
                    startangle=90)
    plt.legend(loc='upper right')
    plt.show()

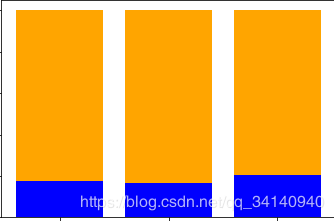
堆叠柱状图
def bar_stack_plot(df_object,title="graphtitle"):
    name_list=['在乎','不在乎']
    notcare=np.array(list(df_object.values[0]))
    care=np.array(list(df_object.values[1]))
    bar_temp= range(len(df_object.columns))
    plt.bar(bar_temp, notcare,color = 'blue', label=name_list[0])
    plt.bar(bar_temp, care, bottom=notcare,color = 'orange', label=name_list[1],tick_label=df_object.columns)
    plt.legend(loc=[1.05,0.8])
    plt.title(title)
    plt.show()

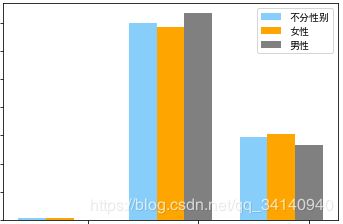
并排柱状图
def bar_paral_plot(df_object,title,colors):
    name_list = df_object.index
    col_name = df_object.columns
    width = 1 / (len(name_list)+1)
    x =list(range(len(name_list)))
    for f_j in range(len(col_name)):
        plt.bar(x, df_object.values[:,f_j],
                width=width,
                label=col_name[f_j],
                fc = colors[f_j],
                tick_label = name_list)
        for i in range(len(x)):
            x[i] = x[i] + width
    plt.legend(col_name)
    plt.title(title)
    plt.show()

colors = ['lightskyblue','orange','grey']
title="graptitle"
bar_paral_plot(df_object,title=title,colors = colors)
做多张图
#画图数据探索

#画图数据
def plt_data(i,j):
    sepal_length = [x[i] for x in iris.data]
    sepal_width = [x[j] for x in iris.data]
    return sepal_length,sepal_width
#画图
def plt_catter(x_axis,y_axis):
    plt.scatter(x_axis[:50], y_axis[:50], color='red', marker='o', label='setosa') #前50个样本
    plt.scatter(x_axis[51:100], y_axis[51:100], color='blue', marker='x', label='versicolor') #中间50个
    plt.scatter(x_axis[101:], y_axis[101:],color='orange', marker='+', label='Virginica') #后50个样本
    plt.legend(loc=2) #左上角
    #plt.show()

plt.figure(figsize=(16, 4)) #画布带澳
plt.subplot(121)               #图的位置:意思为1*2个划分,第1个图
sepal_length,sepal_width=plt_data(0,1)
plt_catter(sepal_length,sepal_width)

plt.subplot(122)               #图的位置:意思为1*2个划分,第2个图
sepal_length,sepal_width=plt_data(2,3)
plt_catter(sepal_length,sepal_width)
plt.show()


