房价预测回归模型--tensorflow2.0学习笔记--tf.keras使用实例
import tensorflow as tf
import matplotlib as mpl
import matplotlib.pyplot as plt
%matplotlib inline
import numpy as np
import sklearn
import pandas as pd
import os
import sys
import time

from tensorflow import keras

print(tf.__version__)
print(sys.version_info)
for module in mpl,np,pd,sklearn,tf,keras:
    print(module.__name__,module.__version__)
导入数据:
from sklearn.datasets import fetch_california_housing

housing=fetch_california_housing()#调用函数
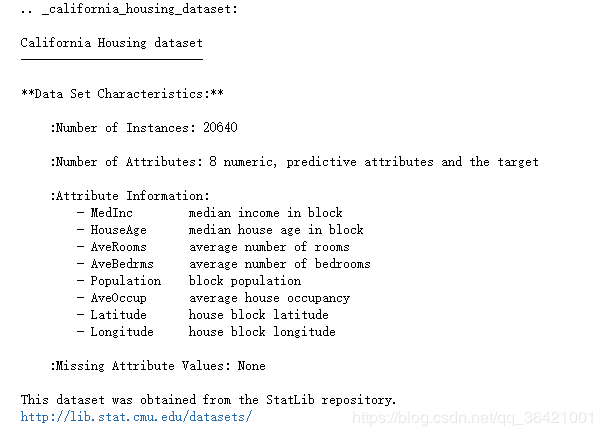
print(housing.DESCR)#打印数据集介绍
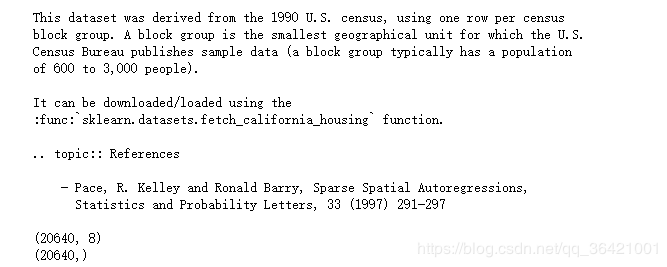
print(housing.data.shape)#打印x轴数据维度
print(housing.target.shape)#打印y轴数据维度
输出:


大概就是介绍了数据来自加州住房数据集,目标变量是加利福尼亚地区的房屋中位价。
import pprint

pprint.pprint(housing.data[0:5])
pprint.pprint(housing.target[0:5])#打印前5组数据
from sklearn.model_selection import train_test_split#数据分类

x_train_all,x_test,y_train_all,y_test = train_test_split(
        housing.data,housing.target,random_state = 7,test_size=0.25)
        #test_size默认0.25,把数据按3:1分给训练集和测试集,random_state随机指定
x_train,x_valid,y_train,y_valid = train_test_split(
        x_train_all,y_train_all,random_state = 11)
        #把训练集总数按1:3分为训练集和数据集

print(x_train_all.shape,y_train_all.shape)#打印数据维度
print(x_train.shape,y_train.shape)
print(x_test.shape,y_test.shape)
print(x_valid.shape,y_valid.shape)
输出:
(15480, 8) (15480,)
(11610, 8) (11610,)
(5160, 8) (5160,)
(3870, 8) (3870,)
from sklearn.preprocessing import StandardScaler#数据标准化

scaler=StandardScaler()
x_train_scaled = scaler.fit_transform(x_train)
x_valid_scaled = scaler.transform(x_valid)
x_test_scaled = scaler.transform(x_test)
模型:
model = keras.models.Sequential([
    keras.layers.Dense(30,activation = 'relu',
                      input_shape = x_train.shape[1:]),
    keras.layers.Dense(1),
])#构建模型,输出为一个数据

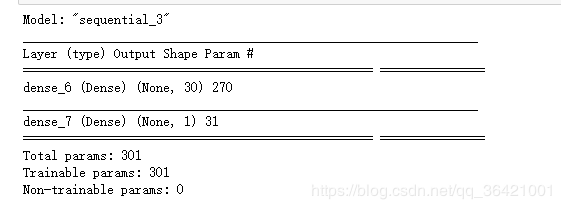
model.summary()#显示模型概况参数
model.compile(loss='mean_squared_error',optimizer = 'sgd')
    #loss采用均方差,optimizer采用随机梯度下降法
callbacks = [keras.callbacks.EarlyStopping(
    patience = 5,min_delta=1e-3)]
history = model.fit(x_train_scaled,y_train,
                    validation_data = (x_valid_scaled,y_valid),
                    epochs = 50,
                    callbacks = callbacks)
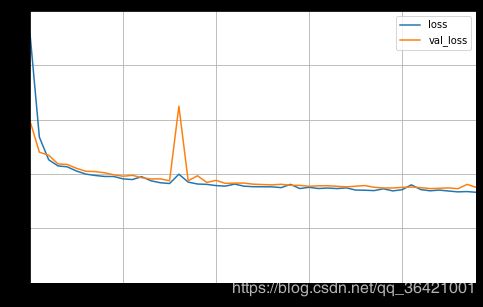
def plot_learning_curves(history):
    pd.DataFrame(history.history).plot(figsize = (8,5))
    plt.grid(True)
    plt.gca().set_ylim(0,1)
    plt.show()

plot_learning_curves(history)
model.evaluate(x_test_scaled,y_test)


