winform Chart图表控件使用(绑定数据)


      在工具箱-数据分组中我们就可以看到chart控件,使用时拖拽到界面即可。可以通过属性面板设置其样式,也可以通过代码来调整样式

设置的属性可参照: https://blog.csdn.net/qq_39569480/article/details/102618832  一定要先了解属性

下面为我直接绑定数据源,如果不懂的话可以先看下这两篇文章

https://www.cnblogs.com/ChaunceyWan/p/11171896.html

https://blog.csdn.net/liuxiaomao1988/article/details/87779801

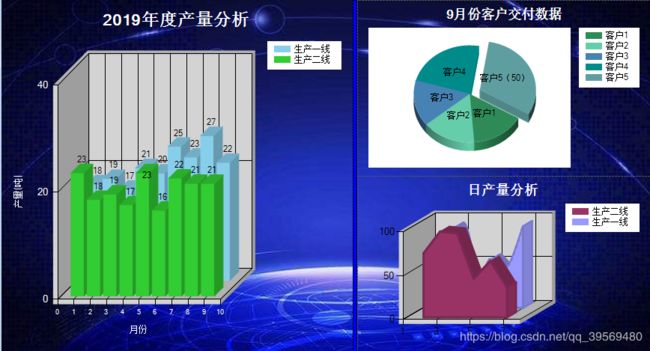
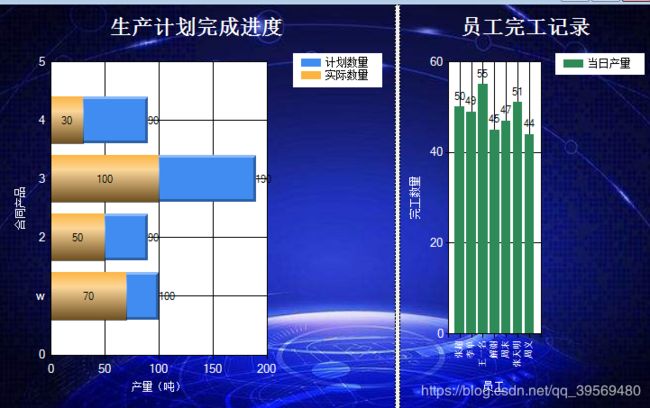
下面展示下自己做技术测试的图片:(有点丑不要介意)

图表3D效果可以在Chart属性的ChartAreas集合中的 Area3DStyle选项中的(Enable3D)设置为true

winform Chart图表控件使用(绑定数据)_第1张图片

winform Chart图表控件使用(绑定数据)_第2张图片

1.柱状图绑定数据如下:

 //绑定年产量
        public void BindYears() {
            PlanRecordManager pr = new PlanRecordManager();
            DataTable dt = pr.getProduction();//获取几条生产线(也就是要添加几个Series)
            if (dt != null)
            {
                ch_Main.Titles.Clear();
                Title t = new Title(DateTime.Now.Year+ "年度产量分析");
                t.DockingOffset = 3;
                t.ForeColor = Color.White; 
                t.Font = new Font("Microsoft Sans Serif", 16, FontStyle.Bold);
                t.TextStyle = TextStyle.Shadow;
                ch_Main.Titles.Add(t);
                ch_Main.Series.Clear();//清理掉默认的图表   然后重新添加
                for (int j = 0; j < dt.Rows.Count; j++)//外层循环几条生产线
                {
                    //添加图表  因为通过数据库得到一个chart中有几个Series 所以此部分写在循环里,如果前提知道有几个Series  可以把外层循环去掉
                    System.Windows.Forms.DataVisualization.Charting.Series s = ch_Main.Series.Add(Convert.ToString(dt.Rows[j]["WorkShopName"]));
                    //设置图标名称
                    //s.ChartArea = "ChartArea" + j;
                    //图表类型   折线  柱状 圆形
                    s.ChartType = System.Windows.Forms.DataVisualization.Charting.SeriesChartType.Column;
                    s.BorderWidth = 3;
                    s.ShadowOffset = 1;
                    s.IsValueShownAsLabel = true;//是否在图表上显示数据的值
                    s.XValueType = System.Windows.Forms.DataVisualization.Charting.ChartValueType.Int32;
                    s.MarkerStyle = System.Windows.Forms.DataVisualization.Charting.MarkerStyle.Circle;//数据点样式
                    for (int i = 1; i <= DateTime.Now.Month; i++)//内层循环月份及数据
                    {
                        //获取当前月产量
                        string Month = i.ToString();
                        if (i < 10)
                        {
                            Month = "0" + Month;
                        }
                        int aa = j;
                        string name = ch_Main.Series[j].Name;
                        DataTable prdt = pr.getYearsProduction(DateTime.Now.Year + "-" + Month, name);//当前年月   图表的名字   获取数据库中的数据
                        int production = 0;//如果当月没有产量直接赋值0
                        if (prdt != null)
                        {
                            production = Convert.ToInt32(prdt.Rows[0]["产量"]);
                        }
                        //这里是最关键的   往Series中添加数据 因为x轴我这里是固定的获取时间不读数据库就循环了一个时间,y轴是通过数据库获取的
                        int r = s.Points.AddXY(i, production);
                        production = 0;
                    }
                }
            }
        }

两个sql

/// 
        /// 获取几条生产线
        /// 
        /// 
        public DataTable getProduction() {
            string sql = "select distinct WorkShopName  from "+ TableDetail + " order by WorkShopName desc";
            DataSet ds = db.Select(sql,null);
            if (ds!=null&&ds.Tables[0].Rows.Count>0)
            {
                return ds.Tables[0];
            }
            return null;
        }

/// 
        /// 年产量分析   每个月产量
        /// 
        /// 
        /// 
        /// 
        public DataTable getYearsProduction(string date,string shop) {
            string sql = "select sum(a.FinishedQty) as 产量 from  "+TableName+" a left join "+ TableDetail + " b on a.PlanRecordID=b.PlanRecordID where  CONVERT(VARCHAR,a.RealEndTime,120) LIKE '"+date+"%' and b.WorkShopName='"+ shop + "'";
            DataSet ds = db.Select(sql, null);
            if (ds != null && ds.Tables[0].Rows.Count > 0)
            {
                if (string.IsNullOrEmpty(ds.Tables[0].Rows[0]["产量"].ToString()))
                {
                    return null;
                }
                return ds.Tables[0];
            }
            return null;
        }

2.饼图

//绑定客户交付数据
        public void BindCustomer()
        {
            PlanRecordManager pr = new PlanRecordManager();
            DataTable dt = pr.getCustomer();//获取所有的客户
            if (dt != null)
            {
                Circular_chart.Series.Clear();//清理掉默认的图表   然后重新添加
                //添加图表   
                System.Windows.Forms.DataVisualization.Charting.Series s = Circular_chart.Series.Add("饼图");
                //设置图标名称
                //s.ChartArea = "ChartArea" + j;
                //图表类型   折线  柱状 圆形
                s.ChartType = System.Windows.Forms.DataVisualization.Charting.SeriesChartType.Pie;
                s.BorderWidth = 3;
                s.ShadowOffset = 1;
                s.IsValueShownAsLabel = true;//是否在图表上显示数据的值
                s.XValueType = System.Windows.Forms.DataVisualization.Charting.ChartValueType.Int32;
                s.MarkerStyle = System.Windows.Forms.DataVisualization.Charting.MarkerStyle.Circle;//数据点样式
                List xData1 = new List();//声明两个集合将数据先放在集合中
                List yData1 = new List();
                for (int i = 0; i < dt.Rows.Count; i++)//
                {
                    string CustomerCode = Convert.ToString(dt.Rows[i]["客户编号"]);
                    DataTable dtProduction = pr.getCustomerProduction(CustomerCode);
                    int production = 0;//如果当月没有产量直接赋值0
                    if (dtProduction != null)
                    {
                        production = Convert.ToInt32(dtProduction.Rows[0]["产量"]);
                    }
                        //将数据先放在集合中
                        xData1.Add(dt.Rows[i][1].ToString());
                        yData1.Add(production.ToString());

                    production = 0;
                }
                //循环结束后,绑定数据源
                Circular_chart.Series[0].Points.DataBindXY(xData1, yData1);
               
            }
        }

两个sql

/// 
        /// 获取多少个客户
        /// 
        /// 
        public DataTable getCustomer()
        {
            string sql = "select distinct CustomerID as 客户编号,CustomerName as 客户名称 from "+ TableDetail + " ";
            DataSet ds = db.Select(sql, null);
            if (ds != null && ds.Tables[0].Rows.Count > 0)
            {
                return ds.Tables[0];
            }
            return null;
        }

/// 
        /// 获取客户的交付数据
        /// 
        /// 
        /// 
        /// 
        public DataTable getCustomerProduction( string CustomerCode)
        {
            string sql = "select sum(a.FinishedQty) as 产量   from  "+TableName+" a left join "+ TableDetail + " b on a.PlanRecordID=b.PlanRecordID where b.CustomerID='"+CustomerCode+"'";
            DataSet ds = db.Select(sql, null);
            if (ds != null && ds.Tables[0].Rows.Count > 0)
            {
                if (string.IsNullOrEmpty(ds.Tables[0].Rows[0]["产量"].ToString()))
                {
                    return null;
                }
                return ds.Tables[0];
            }
            return null;
        }

3样条面积图

 //绑定日产量
        public void BindDay()
        {
            PlanRecordManager pr = new PlanRecordManager();
            DataTable dt = pr.getProduction();
            if (dt != null)
            {
                ch_Day.Series.Clear();//清理掉默认的图表   然后重新添加
                for (int j = 0; j < dt.Rows.Count; j++)//外层循环几条生产线
                {
                    //添加图表
                    System.Windows.Forms.DataVisualization.Charting.Series s = ch_Day.Series.Add(Convert.ToString(dt.Rows[j]["WorkShopName"]));
                    //设置图标名称
                    //s.ChartArea = "ChartArea" + j;
                    //图表类型   折线  柱状 圆形
                    s.ChartType = System.Windows.Forms.DataVisualization.Charting.SeriesChartType.SplineArea;
                    s.BorderWidth = 3;
                    s.ShadowOffset = 1;
                    s.IsValueShownAsLabel = true;//是否在图表上显示数据的值
                    s.XValueType = System.Windows.Forms.DataVisualization.Charting.ChartValueType.Int32;
                    s.MarkerStyle = System.Windows.Forms.DataVisualization.Charting.MarkerStyle.Circle;//数据点样式
                    for (int i = 1; i <= DateTime.Now.Day; i++)//内层循环月份及数据
                    {
                        //获取当天产量
                        string Day = i.ToString();
                        if (i < 10)
                        {
                            Day = "0" + Day;
                        }
                        int aa = j;
                        string name = ch_Main.Series[j].Name;
                        DataTable prdt = pr.getDayProduction(DateTime.Now.ToString("yyyy-MM") + "-" + Day, name);//当前年月   图表的名字
                        int production = 0;//如果当月没有产量直接赋值0
                        if (prdt != null)
                        {
                            production = Convert.ToInt32(prdt.Rows[0]["产量"]);
                        }
                        int r = s.Points.AddXY(i, production);
                        production = 0;
                    }
                }
            }
        }

两个sql

/// 
        /// 获取几条生产线
        /// 
        /// 
        public DataTable getProduction() {
            string sql = "select distinct WorkShopName  from "+ TableDetail + " order by WorkShopName desc";
            DataSet ds = db.Select(sql,null);
            if (ds!=null&&ds.Tables[0].Rows.Count>0)
            {
                return ds.Tables[0];
            }
            return null;
        }

/// 
        /// 日产量分析   当月每天产量
        /// 
        /// 
        /// 
        /// 
        public DataTable getDayProduction(string date, string shop)
        {
            string sql = "select sum(a.FinishedQty) as 产量 from  "+TableName+" a left join "+ TableDetail + " b on a.PlanRecordID=b.PlanRecordID where  CONVERT(VARCHAR,a.RealEndTime,120) LIKE '" + date + "%' and b.WorkShopName='" + shop + "'";
            DataSet ds = db.Select(sql, null);
            if (ds != null && ds.Tables[0].Rows.Count > 0)
            {
                if (string.IsNullOrEmpty(ds.Tables[0].Rows[0]["产量"].ToString()))
                {
                    return null;
                }
                return ds.Tables[0];
            }
            return null;
        }

4.单个柱状图

/// 
        /// 绑定员工完工记录
        /// 
        public void StaffFinish()
        {
            PlanRecordManager pr = new PlanRecordManager();
            DataTable dt= pr.getUserName();
            if (dt != null)
            {
                chart2.Series.Clear();//清理掉默认的图表   然后重新添加
                //添加图表
                System.Windows.Forms.DataVisualization.Charting.Series s = chart2.Series.Add("当日产量");
                //设置图标名称
                //s.ChartArea = "ChartArea" + j;
                //图表类型   折线  柱状 圆形
                s.ChartType = System.Windows.Forms.DataVisualization.Charting.SeriesChartType.Column;
                s.BorderWidth = 3;
                s.ShadowOffset = 1;
                s.IsValueShownAsLabel = true;//是否在图表上显示数据的值
                s.XValueType = System.Windows.Forms.DataVisualization.Charting.ChartValueType.Int32;
                s.MarkerStyle = System.Windows.Forms.DataVisualization.Charting.MarkerStyle.Circle;//数据点样式
                List xData1 = new List();
                List yData1 = new List();
                for (int i = 0; i < dt.Rows.Count; i++)//
                {
                    DataTable prdt = pr.getUserProduction(DateTime.Now.ToString("yyyy-MM-dd"),Convert.ToString(dt.Rows[i][0]));//当前年月   图表的名字
                    int production = 0;//如果当月没有产量直接赋值0
                    if (prdt != null)
                    {
                        production = Convert.ToInt32(prdt.Rows[0]["产量"]);
                    }
                    xData1.Add(dt.Rows[i][0].ToString());
                    yData1.Add(production.ToString());
                    //s.Points.AddXY(i, production);
                    production = 0;
                }
                chart2.Series[0].Points.DataBindXY(xData1, yData1);
            }
        }

两个sql

/// 
        /// 查询所有员工
        /// 
        /// 
        public DataTable getUserName() {
            string sql = "select  distinct UserName  from  "+TableName+" ";
            DataSet ds = db.Select(sql, null);
            if (ds != null && ds.Tables[0].Rows.Count > 0)
            {
                if (string.IsNullOrEmpty(ds.Tables[0].Rows[0]["UserName"].ToString()))
                {
                    return null;
                }
                return ds.Tables[0];
            }
            return null;
        }
        /// 
        /// 查询员工产量
        /// 
        /// 
        public DataTable getUserProduction(string date,string name)
        {
            string sql = "select sum(FinishedQty) as 产量 from "+TableName+"  where CONVERT(VARCHAR,RealEndTime,120) LIKE '" + date+ "%' and UserName='"+name+"'";
            DataSet ds = db.Select(sql, null);
            if (ds != null && ds.Tables[0].Rows.Count > 0)
            {
                if (string.IsNullOrEmpty(ds.Tables[0].Rows[0]["产量"].ToString()))
                {
                    return null;
                }
                return ds.Tables[0];
            }
            return null;
        }

5双层条形图

/// 
        /// 绑定生产计划
        /// 
        public void ProductionPlan() {

            //这里我提前知道一共有两个Series序列  所以 直接可以先写Series的一些属性,然后在循环中再去赋值
            PlanRecordManager pr = new PlanRecordManager();

            //加载计划完成进度
            ch_Process.Series.Clear();//先清除图表中所有图标
            System.Windows.Forms.DataVisualization.Charting.Series s = ch_Process.Series.Add("计划数量");
            s.ChartArea = "ChartArea1";
            s.ChartType = System.Windows.Forms.DataVisualization.Charting.SeriesChartType.StackedBar;
            s.BorderWidth = 3;
            s.ShadowOffset = 1;
            s.IsValueShownAsLabel = true;
            s.XValueType = System.Windows.Forms.DataVisualization.Charting.ChartValueType.Int32;
            s.MarkerStyle = System.Windows.Forms.DataVisualization.Charting.MarkerStyle.Circle;//数据点样式
            DataTable dt = pr.getProductName();
            //计划产量
            for (int i = 1; i < dt.Rows.Count; i++)
            {
                if (string.IsNullOrEmpty( dt.Rows[i]["产品名称"].ToString()))
                {
                    MsgBox.ShowInfoDialog("在获取产品名称时出错,数据库中产品名称为空");
                    return;
                }
                DataTable prdt = pr.getProductPlan(Convert.ToString(dt.Rows[i]["产品编号"]));//当前年月   图表的名字
                int production = 0;//如果当月没有产量直接赋值0
                if (prdt != null)
                {
                    production = Convert.ToInt32(prdt.Rows[0]["计划产量"]);
                }
                    int r = s.Points.AddXY(i, prdt.Rows[0][0]);
                    s.Points[r].AxisLabel =Convert.ToString(dt.Rows[i]["产品名称"]);
                    s.Points[r].CustomProperties = "BarLabelStyle=Outside, DrawingStyle=Emboss";
                    production = 0;
                
            }
            //实际产量
            System.Windows.Forms.DataVisualization.Charting.Series s2 = ch_Process.Series.Add("实际数量");
            s2.ChartArea = "ChartArea1";
            s2.ChartType = System.Windows.Forms.DataVisualization.Charting.SeriesChartType.Bar;
            s2.BorderWidth = 3;
            s2.ShadowOffset = 1;
            s2.IsValueShownAsLabel = true;
            s2.XValueType = System.Windows.Forms.DataVisualization.Charting.ChartValueType.Int32;
            s2.MarkerStyle = System.Windows.Forms.DataVisualization.Charting.MarkerStyle.Circle;//数据点样式
            DataTable dt1 = pr.getProductName();
            //计划产量
            for (int i = 1; i < dt.Rows.Count; i++)
            {
                if (string.IsNullOrEmpty(dt.Rows[i]["产品名称"].ToString()))
                {
                    MsgBox.ShowInfoDialog("在获取产品名称时出错,数据库中产品名称为空");
                    return;
                }
                DataTable prdt = pr.getProductFinish(Convert.ToString(dt.Rows[i]["产品编号"]));//当前年月   图表的名字
                int production = 0;//如果当月没有产量直接赋值0
                if (prdt != null)
                {
                    production = Convert.ToInt32(prdt.Rows[0]["实际产量"]);
                }
                int r = s2.Points.AddXY(i, prdt.Rows[0][0]);
                //s2.Points[r].AxisLabel = Convert.ToString(dt.Rows[i]["产品名称"]);
                s2.Points[r].CustomProperties = "BarLabelStyle=Outside, DrawingStyle=Emboss";
                production = 0;

            }
            //for (int j = 1; j < 6; j++)
            //{

            //    double d = rd.Next(90);
            //    int r = s2.Points.AddXY(j, d);
            //    //s.Points[r].AxisLabel = "产品" + j;
            //    s2.Points[r].CustomProperties = "BarLabelStyle=Center, DrawingStyle=Cylinder";
            //}

        }

三个sql

/// 
        /// 查询所有产品
        /// 
        /// 
        public DataTable getProductName()
        {
            string sql = "select  distinct ProductionCode as 产品编号,ProductionName as 产品名称 from "+ TableDetail + " where  ProductOrder=1 ";
            DataSet ds = db.Select(sql, null);
            if (ds != null && ds.Tables[0].Rows.Count > 0)
            {
                if (string.IsNullOrEmpty(ds.Tables[0].Rows[0]["产品编号"].ToString()))
                {
                    return null;
                }
                return ds.Tables[0];
            }
            return null;
        }
        /// 
        /// 查询产品的计划数量
        /// 
        /// 
        public DataTable getProductPlan(string productcode)
        {
            string sql = "select  sum(PlanQty) as 计划产量   from  "+ TableDetail + "  where  ProductOrder=1 and ProductionCode='"+ productcode + "' ";
            DataSet ds = db.Select(sql, null);
            if (ds != null && ds.Tables[0].Rows.Count > 0)
            {
                if (string.IsNullOrEmpty(ds.Tables[0].Rows[0]["计划产量"].ToString()))
                {
                    return null;
                }
                return ds.Tables[0];
            }
            return null;
        }
        /// 
        /// 查询产品实际产量
        /// 
        /// 
        public DataTable getProductFinish(string productcode)
        {
            string sql = "select  sum(FinishedQty) as 实际产量   from  " + TableDetail + "  where  ProductOrder=1 and ProductionCode='" + productcode + "' ";
            DataSet ds = db.Select(sql, null);
            if (ds != null && ds.Tables[0].Rows.Count > 0)
            {
                if (string.IsNullOrEmpty(ds.Tables[0].Rows[0]["实际产量"].ToString()))
                {
                    return null;
                }
                return ds.Tables[0];
            }
            return null;
        }

架所束缚,让没有整理与归纳的知识,一文不值!高度概括与梳理的知识,才是自己真正的知识与技能。 永远不要让自己的自由、好奇、充满创造力的想法被现实的框创造力自由成长吧! 多花时间,关心他(她)人,正如别人所关心你的。理想的腾飞与实现,没有别人的支持与帮助,是万万不能的。
 

你可能感兴趣的:(C#,winfrom)