elastalert对ELK进行监控报警(CPU利用率告警)
基于Python 3.6版本,版本2不行
下载和配置
您可以使用pip安装ElastAlert的最新发行版:
pip install elastalert或者,您可以克隆ElastAlert存储库以获取最新更改:
git clone https://github.com/Yelp/elastalert.git安装模块:
pip install "setuptools>=11.3"


python setup.py install
根据Elasticsearch的版本,您可能需要手动安装正确版本的elasticsearch-py。
Elasticsearch 5.0+:
pip install "elasticsearch>=5.0.0"Elasticsearch 2.X:
pip install "elasticsearch<3.0.0"进入elastalert根目录,将 config.yaml.example copy一份改名为 config.yaml
cp config.yaml.example config.yaml

vim config.yaml
config.yaml
# 用来加载rule的目录,默认是example_rules
rules_folder: example_rules

# 用来设置定时向elasticsearch发送请求
run_every:
  minutes: 1

# 用来设置请求里时间字段的范围
buffer_time:
  minutes: 15

# elasticsearch的host地址
es_host: 192.168.232.191

# elasticsearch 对应的端口号
es_port: 9200

# 可选的,es url前缀
#es_url_prefix:elasticsearch

# 可选的,查询es的方式,默认是GET
#es_send_get_body_as:GET

# 可选的,选择是否用SSL连接es,true或者false
#use_ssl: True

#可选的,是否验证TLS证书,设置为true或者false,默认为- true
#verify_certs: T
设置Elasticsearch
ElastAlert将有关其查询和警报的信息和元数据保存回Elasticsearch。这对于审核和调试很有用,它使ElastAlert可以重新启动并完全从中断处恢复。ElastAlert不需要运行,但强烈建议使用。
首先,我们需要通过运行elastalert-create-index并遵循以下说明为ElastAlert创建要写入的索引:
$ elastalert-create-index
New index name (Default elastalert_status)
Name of existing index to copy (Default None)
New index elastalert_status created
Done!
创建规则
每个规则都定义要执行的查询,触发匹配的参数以及每个匹配要触发的警报列表。我们将使用它example_rules/example_frequency.yaml作为模板,我们以监控cpu利用率的规则,和发邮件的告警方式来告警:
cd example_rules

cp example_frequency.yaml example_metricbeat_cpu.yaml

vim example_metricbeat_cpu.yaml
es_host: 172.17.0.2

es_port: 9200

name: Example_metricbeat_cpu_rule

type: any

index: metricbeat-*


buffer_time:
   minutes: 1

metric_agg_key: system.load.1
metric_agg_type: avg
query_key: beat.hostname
doc_type: metricsets

bucket_interval:
  minutes: 1

sync_bucket_interval: true

#最大阈值和最小阈值
min_threshold: 0.1
max_threshold: 0.12

http://www.elasticsearch.org/guide/en/elasticsearch/reference/current/query-dsl.html
filter:
- term:
    metricset.name: cpu


# 在4小时内将匹配过滤条件,当CPU使用百分比的值为10%超过5次后,即满足告警条件,然后发送邮件
smtp_host: smtp.163.com
smtp_port: 25
smtp_auth_file: /usr/local/elastalert/smtp_auth.yaml
#回复给那个邮箱
email_reply_to: ***@163.com
#从哪个邮箱发送
from_addr: ***@163.com


# 告警方式
alert:
- "email"

# 发送到这个邮箱
email:
- "***@qq.com"
测试规则:
运行该elastalert-test-rule工具将测试您的配置文件是否成功加载,并在过去的24小时内以调试模式运行它:
elastalert-test-rule example_rules/example_metricbeat_cpu.yaml如果要指定要使用的配置文件,则可以使用config标志运行它:
elastalert-test-rule --config example_rules/example_frequency.yaml 运行ElastAlert :
python3.6 -m elastalert.elastalert --verbose --rule example_metricbeat_cpu.yaml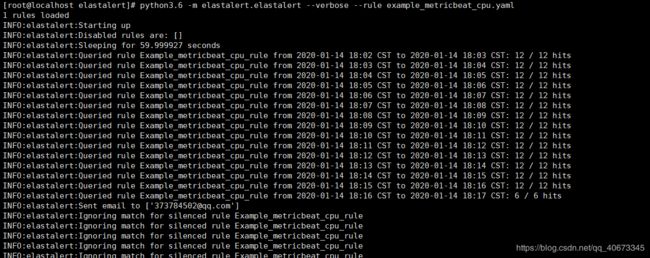

邮箱收到告警邮件:

匹配到174个符合规则的错误,并告警。
关于监控CPU的利用率,使用的是metricbeat,安装配置如下:
Metricbeat监听容器CPU利用率,内存等使用情况,发送给ElasticSearch并展示在kibana