pyechart-Bar基础操作
最简单的Bar
from pyecharts import options as opts
from pyecharts.charts import Bar
x_axis=["first","second","third","forth","fifth"]
simple_y_axis=[1,2,3,4,5]
simpleBar = (
    Bar()
    .add_xaxis(x_axis)
    .add_yaxis("y_axis_name", simple_y_axis)
    .render("simple_bar.html")
)
可选特性
同系列柱间距
在添加y轴时传递参数
.add_yaxis("y_axis_name", simple_y_axis,category_gap="80%")
倾斜横轴标签
添加如下代码:
    .set_global_opts(
        xaxis_opts=opts.AxisOpts(axislabel_opts=opts.LabelOpts(rotate=45)),
    )
添加主副标题
在set_global_opts中添加如下选项
title_opts=opts.TitleOpts(title="我是主标题", subtitle="我是副标题"),
反转x,y轴
render前调用此函数
.reversal_axis()
添加选择功能
在set_global_opts中添加如下选项
brush_opts=opts.BrushOpts(),
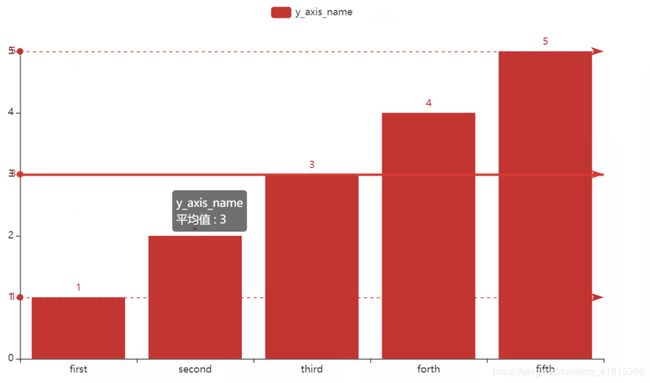
显示某一列最大最小平均值——MarkPoint
在添加y坐标的时候,加上一个参数
.add_yaxis("y_axis_name", simple_y_axis,
        markpoint_opts=opts.MarkPointOpts(
            data=[
                opts.MarkPointItem(type_="max", name="最大值"),
                opts.MarkPointItem(type_="min", name="最小值"),
                opts.MarkPointItem(type_="average", name="平均值"),
            ]),)
显示列最大最小值MarkLine
在render之前,加一个函数调用
.set_series_opts(
    markline_opts=opts.MarkLineOpts(
        data=[
            opts.MarkLineItem(type_="min", name="最小值"),
            opts.MarkLineItem(type_="max", name="最大值"),
            opts.MarkLineItem(type_="average", name="平均值"),
        ]
    ),
)
添加自定义markline
render前调用此函数
.set_series_opts(
    markline_opts=opts.MarkLineOpts(
        data=[opts.MarkLineItem(y=75, name="yAxis=75")]
    ),
添加滑动功能
datazoom_opts=opts.DataZoomOpts(),
自定义y轴显示
yaxis_opts=opts.AxisOpts(
    name="水量",
    type_="value",
    min_=0,
    max_=10,
    interval=1,
    axislabel_opts=opts.LabelOpts(formatter="{value} ml"),# 控制显示格式
    splitline_opts=opts.SplitLineOpts(is_show=True),# 显示分割线
),
显示实时坐标
tooltip_opts=opts.TooltipOpts(
    is_show=True, trigger="axis", axis_pointer_type="cross"
),
显示工具集
toolbox_opts=opts.ToolboxOpts(),
显示的工具集是适合当前图像的工具,如果你的图像比较复杂,提供的工具也会更多

堆叠柱状图
from pyecharts import options as opts
from pyecharts.charts import Bar
x_axis=["first","second","third","forth","fifth"]
simple_y_axis=[1,2,3,4,5]
another_simple_y_axis=[2,3,4,5,6]
simpleBar = (
    Bar()
    .add_xaxis(x_axis)
    #这里的两个stack只要相同就行,随便填写内容
    .add_yaxis("y_axis_name", simple_y_axis,stack="1")
    .add_yaxis("another_y_axis_name", another_simple_y_axis,stack="1")
    .set_global_opts(
        xaxis_opts=opts.AxisOpts(axislabel_opts=opts.LabelOpts(rotate=45)),
    )
    .render("simple_bar.html")
)
通过字典配置Bar
from pyecharts.charts import Bar
x_axis=["first","second","third","forth","fifth"]
# 注意使用字典配置,必须有一个键是value,其他随意
dic_y_axis=[
    {"value":1},
    {"value":2},
    {"value":3},
    {"value":4},
    {"value":5},
]
c = (
    Bar()
    .add_xaxis(x_axis)
    .add_yaxis("dic_y_axis",dic_y_axis)
    .render()
)
效果一样,就不放放图了
多y轴显示
from pyecharts.charts import Bar
x_axis=["first","second","third","forth","fifth"]
simple_y_axis=[1,2,3,4,5]
another_y_axis=[2,3,4,5,6]
simpleBar = (
    Bar()
    .add_xaxis(x_axis)
    .add_yaxis("y_axis_name", simple_y_axis)
    .add_yaxis("another_y_axis", another_y_axis)
    .render()
)
可选特性
控制不同系列间距
添加y轴的时候传递另外参数
.add_yaxis("y_axis_name", simple_y_axis, gap="0%")
.add_yaxis("another_y_axis", another_y_axis, gap="0%")


