TensorFlow2.0(三)--Keras构建神经网络回归模型
Keras构建神经网络回归模型
- 1. 前言
- 1. 导入相应的库
- 2. 数据导入与处理
- 2.1 加载数据集
- 2.2 划分数据集
- 2.3 数据归一化
- 3. 模型构建与训练
- 3.1 神经网络回归模型的构建
- 3.2 神经网络回归模型的训练
- 3.3 绘制学习曲线
- 4. 模型验证
1. 前言
上一篇博客的主要内容是利用tf.keras构建了一个由四层神经网络构成的分类模型,并进行了训练,本篇博客的内容是同样利用keras来构建一个回来解决回归问题(房价预测)的神经网络模型。
1. 导入相应的库
与第上一篇博客中一样,我们需要导入相应的python库
# matplotlib 用于绘图
import matplotlib as mpl
import matplotlib.pyplot as plt
%matplotlib inline
# 处理数据的库
import numpy as np
import sklearn
import pandas as pd
# 系统库
import os
import sys
import time
# TensorFlow的库
import tensorflow as tf
from tensorflow import keras
2. 数据导入与处理
2.1 加载数据集
我们这次使用的数据是来自 sklearn.datasets 中的 fetch_california_housing 的关于加利福尼亚房价的数据集:
from sklearn.datasets import fetch_california_housing
# 获取数据集
housing = fetch_california_housing()
# 打印数据集的信息
print(housing.DESCR)
print(housing.data.shape)
print(housing.target.shape)
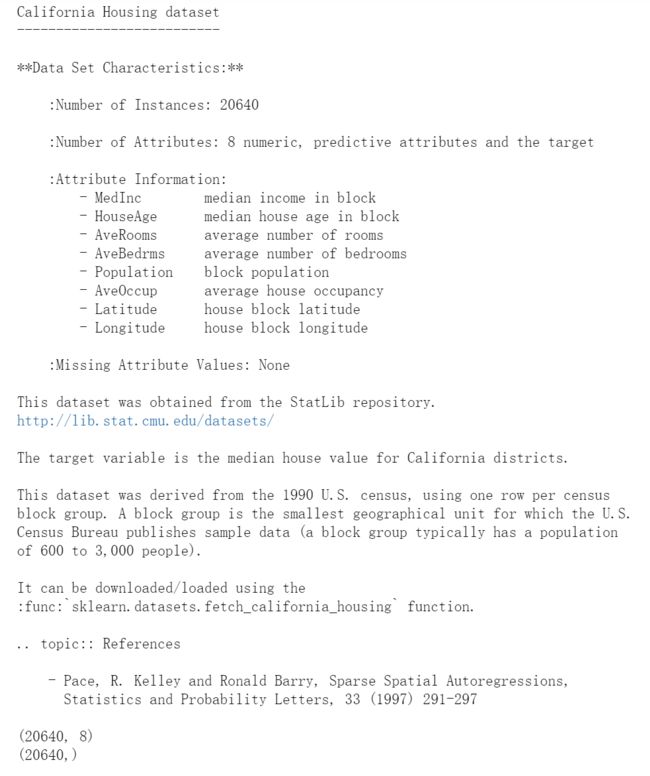
输出结果为:

我们可以看到,这个数据集一共有20640个样本,每个样本的特征维度是8,分别是:收入、房龄、房间数量、卧室数量、街道人口、入住人家、房屋经度、房屋维度等。
我们来看一下前五个数据是什么样子:
import pprint
pprint.pprint(housing.data[0:5])
pprint.pprint(housing.target[0:5])
2.2 划分数据集
我们对得到的数据利用 sklearn.model_selection 中的 train_test_split 进行划分:
from sklearn.model_selection import train_test_split
# test_size 指的是划分的训练集和测试集的比例
# test_size 默认值为0.25 表示数据分四份,测试集占一份
x_train_all, x_test, y_train_all, y_test = train_test_split(housing.data, housing.target, random_state = 7, test_size = 0.25)
x_train, x_valid, y_train, y_valid = train_test_split(x_train_all, y_train_all, random_state = 11, test_size = 0.25)
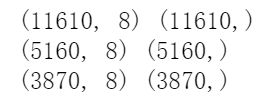
# 打印数据集的维度
print(x_train.shape, y_train.shape)
print(x_test.shape, y_test.shape)
print(x_valid.shape, y_valid.shape)
2.3 数据归一化
数据归一化我们使用上一篇博客中相同的方法:
# 数据归一化
from sklearn.preprocessing import StandardScaler
scaler = StandardScaler()
# 训练集数据使用的是 fit_transform,和验证集与测试集中使用的 transform 是不一样的
# fit_transform 可以计算数据的均值和方差并记录下来
# 验证集和测试集用到的均值和方差都是训练集数据的,所以二者的归一化使用 transform 即可
# 归一化只针对输入数据, 标签不变
x_train_scaled = scaler.fit_transform(x_train)
x_valid_scaled = scaler.transform(x_valid)
x_test_scaled = scaler.transform(x_test)
3. 模型构建与训练
3.1 神经网络回归模型的构建
为方便起见,我们只使用了一层全连接层
model = keras.models.Sequential([
    keras.layers.Dense(10, activation='relu', input_shape=x_train.shape[1:]),
    keras.layers.Dense(1),
])
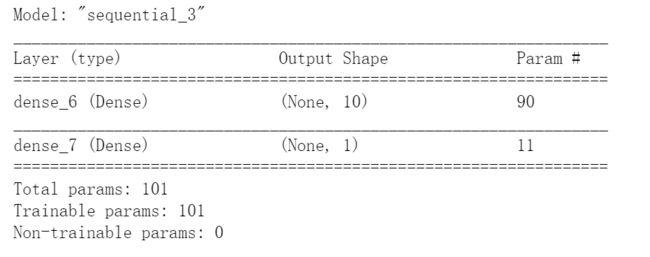
# model.summary 可以显示出网络结构的具体信息
model.summary()
# 编译模型, 损失函数为均方误差函数,优化函数为随机梯度下降
model.compile(loss="mean_squared_error", optimizer = keras.optimizers.SGD(0.001))
# 回调函数使用了EarlyStopping,patience设为5, 阈值设置为1e-2
callbacks = [keras.callbacks.EarlyStopping(patience=5, min_delta=1e-2)]
3.2 神经网络回归模型的训练
下面开始训练模型,训练周期为100次:
history = model.fit(x_train_scaled, y_train,
                   validation_data=(x_valid_scaled, y_valid),
                   epochs = 100,
                   callbacks= callbacks)
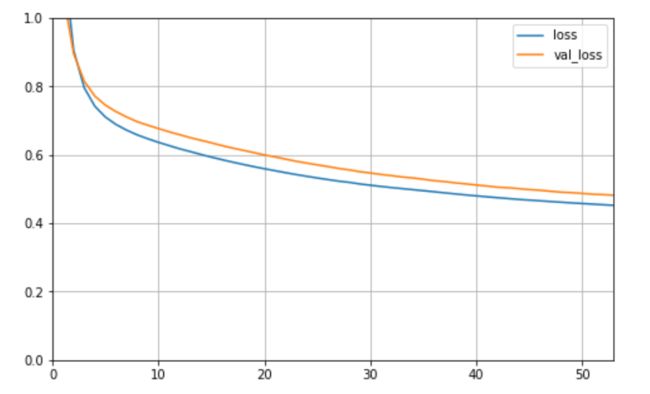
3.3 绘制学习曲线
训练模型完毕之后,我们来看一下它的学习曲线:
def plot_learning_curves(history):
    pd.DataFrame(history.history).plot(figsize=(8,5))
    plt.grid(True)
    plt.gca().set_ylim(0,1)
    plt.show()
plot_learning_curves(history)
4. 模型验证
对于训练好的模型,我们可以使用model.evaluate()进行在验证集上的验证:
model.evaluate(x_test_scaled, y_test)


