SpringBoot dataJpa + thymeleaf +Mysql+ echarts 数据展示
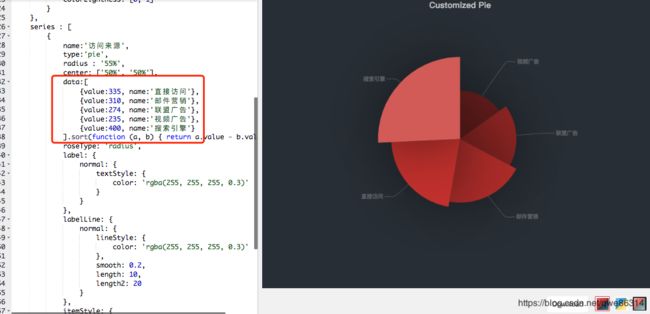
1.网上有很多的代码说怎么用,但是这里我还是想分享一下我的做法,非常的简单,通常去echarts官方的实例,会看到明确要求的数据格式。如下图所示:

从上图不难看出这是一对键值对的方式,如何去封装这些数据常见的方式就是用Map去封装 ,然后在用Json将封装好的Map进行Json转换。最后用model.attribute 进去。到页面 就可以使用[[${xxxxx}]]来取值,thymeleaf支持这种取值方式。
废话不多说了。下面直接开始上代码(这里我已饼图来做实例)
第一步创建一个通用保存数据的bean,代码如下:
/**
 * 填充数据格式
 */
public class echarts {

    private Long value;
    private String  name;


    public echarts() {
    }

    public echarts(Long value, String name) {
        this.value = value;
        this.name = name;
    }

    public Long getValue() {
        return value;
    }

    public void setValue(Long value) {
        this.value = value;
    }

    public String getName() {
        return name;
    }

    public void setName(String name) {
        this.name = name;
    }

    @Override
    public String toString() {
        return "echarts{" +
                "value=" + value +
                ", name='" + name + '\'' +
                '}';
    }
第二步你需要数据查询出来:
     @Query(value = "select count (u.type) from UserMessageInfo u where u.type =?1")
       Long findByType(String type);
这里的SQL我是统计个数 默认查询出来只有value
Service实现:
Long findByType(String type);
ServiceImpl:
    @Autowired
    private SchoolUserInfoRepository echartsRepository;
    @Override
        public Long findByType(String type) {

        return echartsRepository.findByType(type);
    }
第三部操作Controller:
Controller
    public class echartsController {

        @Autowired
        private echartsService echartsService;

        @Autowired
        private Gson gson;

        @RequestMapping(value = "/getEcharts")
        public String getResult() {

            return "admin/echarts_count";

        }

        @GetMapping("/getData")
        @ResponseBody
        public List<echarts> getData(Model model) {

            List<echarts> results = new ArrayList<echarts>();
            echarts echart = new echarts();
            echarts echart2 = new echarts();
            echart.setValue(echartsService.findByType("out"));
            echart.setName("留校信息");
            results.add(echart);
            echart2.setValue(echartsService.findByType("stay"));
            echart2.setName("离校信息");
            results.add(echart2);
            model.addAttribute("data", gson.toJson(results));
            System.out.println(gson.toJson(results));

            return results;
        }

    }
注意:这里使用了一个List来装载这个echartsBean的数据,
这里我用的是Google 的Gson 将封装好的数据转换成Json
还有注意的是我的Dao查询出来默认就只有1个value数据,这里通过echartsBean设置了name,这样就和官网要求的格式一样了,就是这样的:
[{“value”:3,“name”:“留校信息”},{“value”:3,“name”:“离校信息”}]
admin/echarts_count页面
<html style="height: 100%" lang="en" xmlns:th="http://www.thymeleaf.org">

<head>
    <meta charset="UTF-8">
    <title>数据可视化title>
head>
<body style="height: 100%; margin: 0">
<div  id="main1"
      style="height: 100%">div>

div>

<div id="mychars" style="height: 300px;width: 400px;">div>

<script src="/static/js/echarts.min.js">script>
<script src="/static/js/jquery-3.3.1.min.js">script>

<script type="text/javascript">

    //饼图
    var myChart1 = echarts.init(document.getElementById('main1'));
    option1 = {
        backgroundColor: '#2c343c',

        title: {
            text: '留校信息统计',

            left: 'center',
            top: 20,
            textStyle: {
                color: '#ccc'
            }
        },

        tooltip : {
            trigger: 'item',
            formatter: "{a}
{b} : {c} ({d}%)"
        },
        legend: {
            orient: 'vertical',
            x: 'left',
            data:['留校信息','离校信息'],
            color: '#c2182d',
            textStyle: {
                color: '#fbf9ff'
            }
        },


        series : [
            {
                name:'访问来源',
                type:'pie',
                radius : '55%',
                center: ['50%', '50%'],
                data:[
                    {value:335, name:'直接访问'},
                    {value:310, name:'邮件营销'},
                    {value:274, name:'联盟广告'},
                    {value:235, name:'视频广告'},
                    {value:400, name:'搜索引擎'}
                ].sort(function (a, b) { return a.value - b.value; }),
                roseType: 'radius',
                label: {
                    normal: {
                        textStyle: {
                            color: 'rgba(255, 255, 255, 0.3)'
                        }
                    }
                },
                labelLine: {
                    normal: {
                        lineStyle: {
                            color: 'rgba(255, 255, 255, 0.3)'
                        },
                        smooth: 0.2,
                        length: 10,
                        length2: 20
                    }
                },
                itemStyle: {
                    normal: {
                        color: '#c23531',
                        shadowBlur: 200,
                        shadowColor: 'rgba(0, 0, 0, 0.5)'
                    }
                },

                animationType: 'scale',
                animationEasing: 'elasticOut',
                animationDelay: function (idx) {
                    return Math.random() * 200;
                }
            }
        ]
    };


 //这里是ajax获取Controller的数据
    function getData(){
       $.ajax({
           url : "/getData",
           type : "GET",
           dataType : "json",
           success : function(result) {
               if (result) {
                   myChart1.setOption({
                       series:[{
                           data:result
                       }]
                   });
               }
           }

       });


   }
    myChart1.setOption(option1);
   //这里是2秒自动刷新,这样数据库一旦有新的记录 就不用手动刷新页面就能显示新的数据。
    setInterval(function () {
     getData();

    },2000)

script>
body>

html>
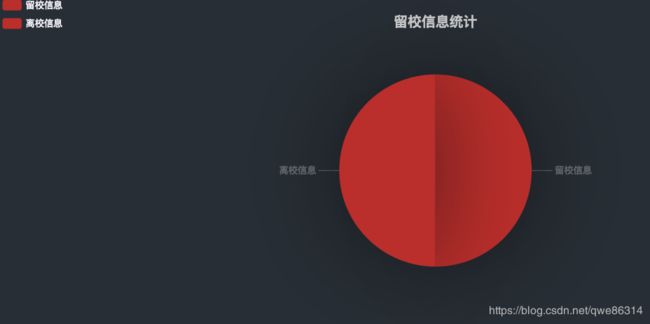
下面是最终的效果图
