matplotlib画图,这一篇就够了(使用Python画常见的柱状图、折线图、直方分布图、二维和三维的散点图,热力图)
目录
- 画柱状图
- 画折线图
- 画直方分布图
- 改进(自由设置坐标刻度、横纵坐标重合)
- 画二维散点图(包括坐标刻度用科学计数法)
- 画三维散点图
- 画热力图(相关系数矩阵图)
为了达到美观的效果,本文给出的例子都稍微有点复杂。但是使用起来并不困难,只需要将对应位置的变量替换成自己的数据即可。代码看起来有点多是为了便于理解,所有的参数都加了注释,实现功能的代码量并不是很多,对于只想使用基础画图功能的,可以通过删减参数达到简化的目的。
画柱状图
import matplotlib.pyplot as plt
import numpy as np
FontSize=15#这里统一设置一下表示尺寸的变量,后面的所有尺寸就用这个,全图的尺寸保持一致

x = list(range(1,24,4))#首先设置好X轴上面每个标签的间隔
x1=[i-0.25 for i in x]#因为有四个柱子,这里设置每个柱子的位置,这个值跟每个柱子的宽度width有关
x2=[i-0.75 for i in x]
x3=[i+0.25 for i in x]
x4=[i+0.75 for i in x]


plt.figure(figsize=(12, 10))#设置整个图的尺寸,12表示长度,10表示宽度
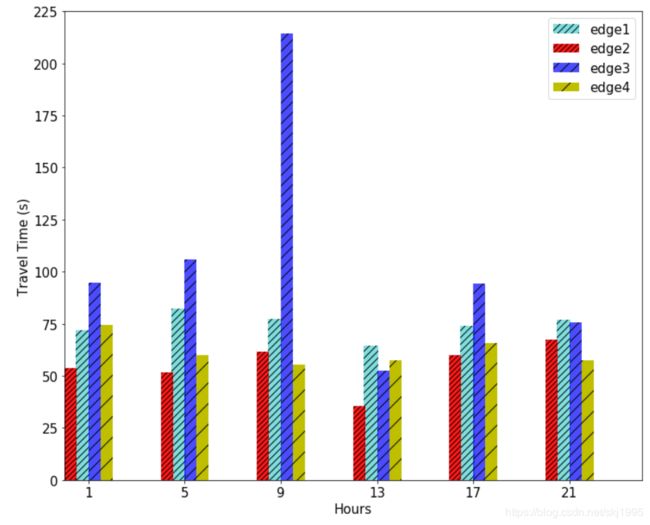
#下面是画每个柱子,y1,y2,y3,y4是自己需要画的每个x的值对应的值,比如这里的y2=[53,51,61,35.6,60,67.2],维度与X一致
#color表示这个柱子的颜色,align=“center”表示边界值在每个柱子的中间,默认值left表示在左边;label是图例名称,
#hatch是填充条纹格式,alpha表示透明度
plt.bar(x1, y1,width = 0.5,color = 'c',align = 'center',label = 'edge1',hatch='///',alpha = 0.5,)
plt.bar(x2, y2,width = 0.5,color = 'r',align = 'center',label = 'edge2',hatch='////',alpha = 0.9)
plt.bar(x3, y3,width = 0.5,color = 'b',align = 'center',label = 'edge3',hatch='//',alpha = 0.7)
plt.bar(x4, y4,width = 0.5,color = 'y',align = 'center',label = 'edge4',hatch='/',alpha = 1)


plt.legend(loc = 'upper right',fontsize=FontSize)#设置图例位置和图例中字体的大小
plt.xticks(fontsize=FontSize)#这里设置x轴和Y轴上面标度的字体大小
plt.yticks(fontsize=FontSize)
plt.xlim(0,24)#限制X轴和Y轴的起止点
plt.ylim(0,225)
plt.xlabel('Hours', fontsize=FontSize)#设置X轴和Y轴的标签
plt.ylabel('Travel Time (s)', fontsize=FontSize)
plt.savefig('/MyDocument/picture.jpg',bbox_inches = 'tight')#保存,bbox_inches防止保存的图形不全
其中设置柱子颜色的color的其他选项有:
参考链接:
http://www.sofasofa.io/forum_main_post.php?postid=1002595

hatch表示柱子的填充颜色,其他选项有:{’/’, ‘’, ‘|’, ‘-’, ‘+’, ‘x’, ‘o’, ‘O’, ‘.’, ‘*’},通过增加字符串里面的个数就可以增加填充密度,比如"///“比”/"密集
参考链接:https://www.jianshu.com/p/e8033e25e1aa
还有关于matplotlib.bar的其他参数可以参考它的官方网址:
https://matplotlib.org/api/_as_gen/matplotlib.pyplot.bar.html?highlight=bar#matplotlib.pyplot.bar
画折线图
import matplotlib.pyplot as plt
from pylab import *
mpl.rcParams['font.sans-serif'] = ['SimHei']#支持中文
FontSize=12
f, ax = plt.subplots(figsize=(12,6))  #设置所画图的大小,12表示长度,6表示宽度
x=[1,2,3,4,5,6,7,8,9,10]  #这是X变量,需要画出10个点的折线
MarkerSize=8  #用来设置折点样式的大小
plt.xlim(0, 11)  # 限定横轴的范围
plt.ylim(0, 1100)  # 限定纵轴的范围

#plt.plot用来画折线图,marker表示折点的样式,比如图中的小圆点、正方形等,mec设置折点边框的颜色,mfc表示折点内部的颜色
#markersize设置折点的大小,linestyle设置线条样式,label设置图例里面的名称,color设置线条的颜色
plt.plot(x, y1, marker='^', mec='black', mfc='w',markersize=MarkerSize,linestyle=":",label="LSTM-ED",color="black")
plt.plot(x, y2, marker='*', mec='b', mfc='w',markersize=MarkerSize,linestyle="--",label="SimTrack-CNN",color="blue")
plt.plot(x, y3, marker='s', mec='orange', mfc='w',markersize=MarkerSize,linestyle="-",label="SimTrack-GCN",color="orange")
plt.plot(x, y4, marker='o', mec='r', mfc='w',markersize=MarkerSize,linestyle="-.",label="SimTrack-DGCN",color="red")
plt.plot(x, y5, marker='d', mec='g', mfc='w',markersize=MarkerSize,linestyle="-",label="otherSim-DGCN",color="green")

plt.legend(fontsize=FontSize)  # 让图例生效
plt.xticks(list(range(1,11)),list(range(1,11)),fontsize=FontSize)
plt.yticks(fontsize=FontSize)
plt.margins(0)#plt.margins()调整图形方框内绘图距离坐标轴的程度
plt.subplots_adjust(bottom=0.15)
plt.xlabel(u"Prediction Step Size",fontsize=FontSize) #X轴标签
plt.ylabel("Run Time (minutes)",fontsize=FontSize) #Y轴标签
plt.savefig('/MyDocument/Picture2.jpg',bbox_inches = 'tight')
plt.show()
linestyle有以下几种:

参考链接:
https://blog.csdn.net/aquapisces/article/details/90600525
marker选项参考地址:
https://stackoverflow.com/questions/8409095/matplotlib-set-markers-for-individual-points-on-a-line
plt.plot的官网地址:
https://matplotlib.org/xkcd/users/pyplot_tutorial.html
画直方分布图
import numpy as np
from matplotlib import pyplot as plt
import seaborn as sns
import math
fig,ax=plt.subplots()
np.random.seed(4) #设置随机数种子
y=AllBigDisIndex_differ

plt.xlabel('Trajectory Length(m)', fontsize=FontSize)
plt.ylabel('Frequency', fontsize=FontSize)
bins=list(range(0,251,20))#这是设置组距
plt.hist(y,bins,density=True)
#plt.savefig('/data/User/skj/AGraduationArticle/Picture/TrajectLenDistributionHistogram.jpg',bbox_inches = 'tight')
plt.show()
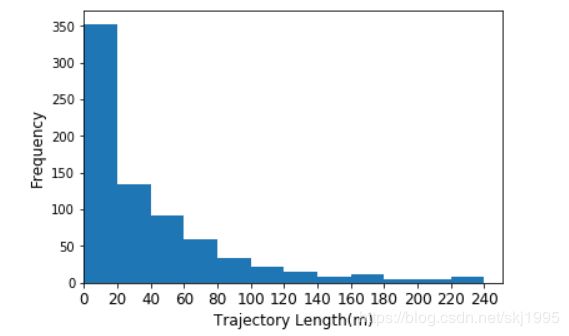
这里需要清楚的是,频率分布直方图的纵轴的值是频率(频数除以总数)除以组距得到的,比如我这里组距为20.[0,20]这一组内的频率为0.5左右,除以20为0.025,所以上图中纵轴的最大值为0.025左右。
改进(自由设置坐标刻度、横纵坐标重合)
上面的图有个问题,就是横轴上面的标度没有落在每组的分割值上,而且比较少,看起来不能很直观地看到组之间的边界值。这就涉及到如何自由地设置坐标轴上的刻度。还有一个问题是横轴坐标的起点不在同一个点上,我们将图形和代码改成如下形式:

import numpy as np
from matplotlib import pyplot as plt
import seaborn as sns
import math
fig,ax=plt.subplots()
np.random.seed(4) #设置随机数种子
plt.xlim(0, 251)  # 限定横轴的范围
plt.xticks(range(0,251,20),range(0,251,20),fontsize=FontSize)#设置坐标刻度
plt.xlabel('Trajectory Length(m)', fontsize=FontSize)
plt.ylabel('Frequency', fontsize=FontSize)
bins=list(range(0,251,20))#这是设置组距
plt.hist(y,bins,density=True)#y是一个list,里面保存着所有的值
#plt.savefig('/data/User/skj/AGraduationArticle/Picture/TrajectLenDistributionHistogram.jpg',bbox_inches = 'tight')
plt.show()
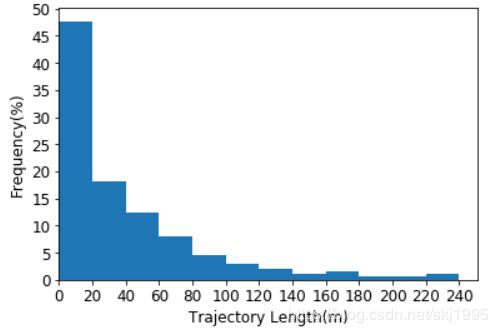
上面图形中,纵轴是频率除以组距,有时候我们不能一眼看出每组所占比例的大小,我们可以把纵轴改成百分比频率的形式。
我们首先将上面代码plt.hist(y,bins,normed=False)中的normed改成False,画出结果如下:

我们想要的图为:

代码为:
import numpy as np
from matplotlib import pyplot as plt
import seaborn as sns
import math
fig,ax=plt.subplots()
np.random.seed(4) #设置随机数种子
y=AllBigDisIndex_differ
plt.xlim(0, 251)  # 限定横轴的范围
plt.xticks(range(0,251,20),range(0,251,20),fontsize=FontSize)#设置X轴坐标刻度
plt.yticks(range(0,371,37),range(0,51,5),fontsize=FontSize)  #设置Y轴坐标刻度
plt.xlabel('Trajectory Length(m)', fontsize=FontSize)
plt.ylabel('Frequency(%)', fontsize=FontSize)
bins=list(range(0,251,20))#这是设置组距
plt.hist(y,bins,normed=False)
#plt.savefig('/data/User/skj/AGraduationArticle/Picture/TrajectLenDistributionHistogram.jpg',bbox_inches = 'tight')
plt.show()
上面加了一句:plt.yticks(range(0,371,37),range(0,51,5),fontsize=FontSize) #设置Y轴坐标刻度
因为len(y)=740,我们如果要纵轴上显示[0,5%,10%,15%…],那么我们首先计算对应频数的值,740*5%=37.也就是原来的37对应5%,74对应10%,以此类推。接着我们确定Y轴显示的最大值。我们看频数图可以发现最大值在350附近,比350大的最近的以5为倍数的百分比是50%,也就是370,所以我们设置为range(0,371,37),range(0,51,5)
画二维散点图(包括坐标刻度用科学计数法)
from matplotlib.ticker import FuncFormatter
FontSize=15
x_values = range(1, len(GroupBy_list)+1)
y_values = GroupBy_list#GroupBy_list是自己的数据
f, ax = plt.subplots(figsize=(12,6))
ax.scatter(x_values, y_values , color='b', label='A', marker='o', s=2)

#下面这四句是Y轴标度使用科学计数法
def formatnum(x, pos):
    return '$%.1f$x$10^{5}$' % (x/100000)
formatter1 = FuncFormatter(formatnum)
ax.yaxis.set_major_formatter(formatter1)

plt.xlabel('Ranking of frequency', fontsize=14)
plt.ylabel('Appearing frequency', fontsize=14)
plt.tick_params(axis='both', which='major', labelsize=14)
plt.xticks(list(range(0,2000,500)),list(range(0,4000,500)),fontsize=FontSize)
plt.xlim(0,3500)
plt.ylim(0,300000)

plt.savefig('/data/User/skj/AGraduationArticle/Picture/ZipfsLaw.jpg',bbox_inches = 'tight')
plt.show()
使用科学计数法的参考链接:
https://blog.csdn.net/monotonomo/article/details/83826621#_7
画三维散点图
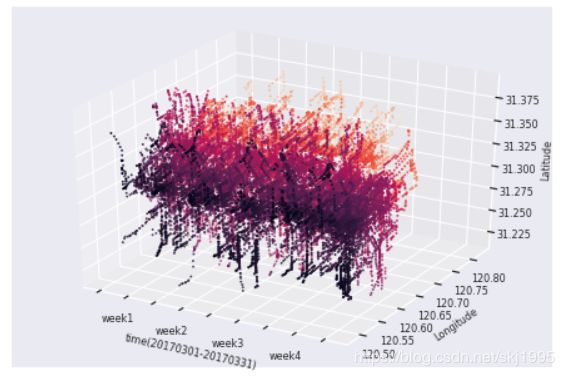
代码如下:
import matplotlib.pyplot as plt
from mpl_toolkits.mplot3d import Axes3D
from matplotlib.font_manager import FontProperties
font = FontProperties(fname=r"C:\Windows\Fonts\simhei.ttf", size=14)
FontSize=8
fig = plt.figure()
ax = Axes3D(fig)

#X下面传入我们的X,Y,Z轴坐标的list
ydata =LuKouData_onevehicle_allday_JD
zdata = LuKouData_onevehicle_allday_WD
xdata = list(range(len(ydata)))

ax.scatter(xdata, ydata, zdata, c=ydata,s=1)#使用这个函数画三维散点图
#设置X轴需要显示的刻度
plt.xticks([0,3750,7500,11250,15000,18750,22500,26250,30000],["","week1","","week2","","week3","","week4",""],fontsize=FontSize)
plt.yticks(fontsize=FontSize)
plt.tick_params(labelsize=8)#设置所有ticker的字体大小

#下面是设置三个轴的标签
ax.set_zlabel('Latitude',fontsize=FontSize) #设置Z轴标签
plt.xlabel('time(20170301-20170331)',fontsize=FontSize)
plt.ylabel('Longitude',fontsize=FontSize)

plt.savefig('/data/User/skj/AGraduationArticle/Picture/Spatiotemporal distribution of trajectories.png',bbox_inches = 'tight')
plt.show()
画热力图(相关系数矩阵图)
import seaborn as sns
import numpy as np
import pandas as pd

fig, ax = plt.subplots(figsize = (12,7))

#下面的参数为:DataList是一个多位列表,pd.DataFrame把它转化为dataframe格式的数据,columns和index分别是列名和行名
#annot=False表示不在每个小块标出值,vmax和vmin表示图中画出的最大值和最小值,xticklabels表示X轴上面是否标刻度,
#square=False表示每个小块是不是必须为正方形,cmap="hot"表示图形的颜色,cbar=True表示右边的标尺
sns.heatmap(pd.DataFrame(np.round(DataList,2), columns = list(range(20)), index = range(1,21)),
                annot=False, vmax=5659,vmin = 0, xticklabels= False, yticklabels= False, square=False,cmap="hot",cbar=True)
#ax.set_title('二维数组热力图', fontsize = 18)#设置图名
ax.set_ylabel('y-axis', fontsize = 18) #设置y轴标签
ax.set_xlabel('x-axis', fontsize = 18) #设置x轴标签
#plt.savefig('/data/User/skj/AGraduationArticle/Picture/Spatiotemporal_8days/'+'example1.jpg',bbox_inches = 'tight')
这里DataList的值为:
[[0, 0, 0, 0, 0, 0, 0, 0, 34, 0, 0, 0, 0, 0, 0, 0, 0, 0, 0, 0],
 [0, 0, 0, 0, 1210, 0, 0, 2329, 962, 3878, 0, 426, 1423, 0, 0, 0, 0, 0, 0, 0],
 [0, 0, 0, 0, 0, 0, 0, 0, 0, 0, 0, 0, 0, 0, 0, 0, 0, 0, 0, 0],
 [0, 0, 0, 0, 0, 0, 0, 0, 0, 0, 0, 0, 0, 0, 0, 0, 0, 0, 0, 0],
 [0, 0, 0, 0, 0, 0, 0, 0, 0, 0, 0, 0, 0, 0, 0, 0, 0, 0, 0, 0],
 [0, 0, 0, 0, 0, 0, 0, 0, 0, 0, 0, 0, 420, 1793, 0, 313, 0, 0, 0, 0],
 [0, 0, 0, 0, 0, 0, 0, 0, 0, 0, 0, 638, 0, 0, 0, 0, 0, 0, 0, 0],
 [0, 0, 0, 0, 0, 0, 0, 0, 0, 674, 516, 3758, 113, 0, 2473, 0, 0, 0, 0, 0],
 [0, 0, 0, 0, 0, 0, 0, 0, 1172, 1205, 0, 1755, 41, 1119, 1254, 0, 72, 0, 0, 0],
 [0, 0, 0, 0, 0, 0, 0, 1115, 0, 504, 531, 800, 228, 265, 0, 0, 0, 0, 0, 0],
 [3630, 0, 251, 0, 0, 0, 0, 736, 902, 0, 514, 0, 680, 0, 363, 644, 0, 0, 0, 0],
 [0, 0, 0, 1408, 0, 0, 0, 630, 2870, 0, 468, 0, 0, 0, 0, 0, 0, 0, 0, 0],
 [0, 0, 0, 0, 0, 0, 0, 0, 0, 0, 490, 0, 0, 0, 0, 0, 0, 0, 0, 0],
 [0, 0, 0, 0, 0, 0, 0, 1232, 0, 482, 398, 0, 1039, 0, 782, 0, 709, 0, 0, 0],
 [0, 378, 864, 0, 0, 0, 0, 0, 0, 0, 0, 0, 271, 1968, 0, 0, 0, 0, 0, 0],
 [0, 0, 0, 0, 0, 0, 0, 711, 0, 0, 0, 0, 0, 0, 0, 0, 0, 0, 0, 0],
 [0, 0, 0, 0, 0, 0, 0, 0, 0, 0, 0, 0, 0, 0, 0, 0, 0, 0, 0, 0],
 [0, 0, 0, 0, 0, 0, 0, 0, 0, 0, 0, 0, 0, 0, 0, 0, 0, 0, 0, 0],
 [0, 0, 0, 0, 0, 0, 0, 0, 0, 0, 0, 0, 0, 0, 0, 0, 0, 0, 0, 0],
 [0, 0, 0, 0, 0, 0, 0, 0, 0, 0, 0, 0, 0, 0, 0, 0, 0, 0, 0, 0]]
是一个20*20的多维数组
cmap颜色设置额其他选项:
https://blog.csdn.net/linzhjbtx/article/details/85319554
画热力图的其他参考链接
https://blog.csdn.net/henbile/article/details/80241597


