Python 饼图
python 画图--饼图
这是python画图系列第三篇--饼图
画饼图用到的方法为:
matplotlib.pyplot.pie()
参数为:
pie(x, explode=None, labels=None,
colors=('b', 'g', 'r', 'c', 'm', 'y', 'k', 'w'),
autopct=None, pctdistance=0.6, shadow=False,
labeldistance=1.1, startangle=None, radius=None,
counterclock=True, wedgeprops=None, textprops=None,
center = (0, 0), frame = False )
参数说明:
x (每一块)的比例,如果sum(x) > 1会使用sum(x)归一化
labels (每一块)饼图外侧显示的说明文字
explode (每一块)离开中心距离
startangle 起始绘制角度,默认图是从x轴正方向逆时针画起,如设定=90则从y轴正方向画起
shadow 是否阴影
labeldistance label绘制位置,相对于半径的比例, 如<1则绘制在饼图内侧
autopct 控制饼图内百分比设置,可以使用format字符串或者format function
'%1.1f'指小数点前后位数(没有用空格补齐)
pctdistance 类似于labeldistance,指定autopct的位置刻度
radius 控制饼图半径
返回值:
如果没有设置autopct,返回(patches, texts)
如果设置autopct,返回(patches, texts, autotexts)
patches -- list --matplotlib.patches.Wedge对象
texts autotexts -- matplotlib.text.Text对象
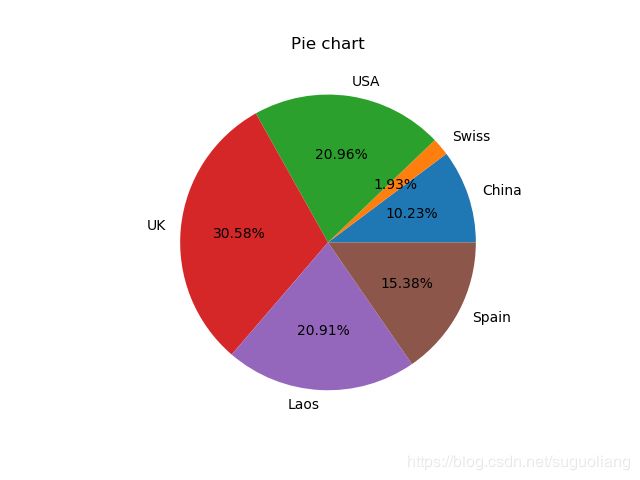
下面是一个简单的示例:
# -*- coding: utf-8 -*-
import numpy as np
import matplotlib.mlab as mlab
import matplotlib.pyplot as plt
labels=['China','Swiss','USA','UK','Laos','Spain']
X=[222,42,455,664,454,334]
fig = plt.figure()
plt.pie(X,labels=labels,autopct='%1.2f%%') #画饼图(数据,数据对应的标签,百分数保留两位小数点)
plt.title("Pie chart")
plt.show()
plt.savefig("PieChart.jpg")
下面是结果:
# -*- coding: utf-8 -*-
import numpy as np
import matplotlib.pyplot as plt
import matplotlib as mpl
def draw_pie(labels,quants):
# make a square figure
plt.figure(1, figsize=(6,6))
# For China, make the piece explode a bit
expl = [0,0.1,0,0,0,0,0,0,0,0] #第二块即China离开圆心0.1
# Colors used. Recycle if not enough.
colors = ["blue","red","coral","green","yellow","orange"] #设置颜色(循环显示)
# Pie Plot
# autopct: format of "percent" string;百分数格式
plt.pie(quants, explode=expl, colors=colors, labels=labels, autopct='%1.1f%%',pctdistance=0.8, shadow=True)
plt.title('Top 10 GDP Countries', bbox={'facecolor':'0.8', 'pad':5})
plt.show()
plt.savefig("pie.jpg")
plt.close()
# quants: GDP
# labels: country name
labels = ['USA', 'China', 'India', 'Japan', 'Germany', 'Russia', 'Brazil', 'UK', 'France', 'Italy']
quants = [15094025.0, 11299967.0, 4457784.0, 4440376.0, 3099080.0, 2383402.0, 2293954.0, 2260803.0, 2217900.0, 1846950.0]
draw_pie(labels,quants)

