10- OpenCV+TensorFlow 入门人工智能图像处理-图像修复
灰度直方图源码
灰度直方图的本质是为了统计图像中每个像素灰度出现的概率
横坐标: 0-255 纵坐标概率 p(0-1)
# 1 0-255 2 概率
import cv2
import numpy as np
import matplotlib.pyplot as plt
%matplotlib inline
img = cv2.imread('image0.jpg',1)
imgInfo = img.shape
height = imgInfo[0]
width = imgInfo[1]
# 灰度化
gray = cv2.cvtColor(img,cv2.COLOR_BGR2GRAY)
# count 记录每个灰度值出现的概率
count = np.zeros(256,np.float)
# for循环遍历图片中的每个点
for i in range(0,height):
    for j in range(0,width):
        # 获取当前图片的灰度值
        pixel = gray[i,j]
        # 转换为int类型
        index = int(pixel)
        # 把这个灰度系数,如count的第255个元素原本值是0现在+1
        count[index] = count[index]+1
# 统计完灰度等级,计算出现概率
for i in range(0,255):
    count[i] = count[i]/(height*width)
# 使用Matplotlib的绘图方法
# 0-255 个数256个
x = np.linspace(0,255,256)
y = count
plt.bar(x,y,0.8,alpha=1,color='b')
plt.show()
cv2.waitKey(0)
使用Inline在浏览器中显示颜色不正确。而删掉这行是蓝色的。
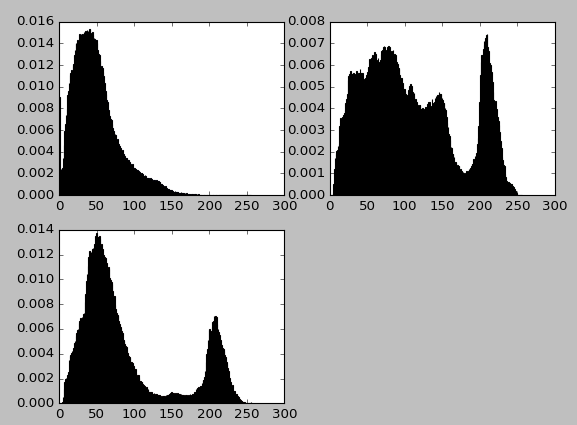
彩色直方图源码
# 本质:统计每个像素灰度 出现的概率 0-255 p
# 对于彩色直方图来说是分别统计三个通道
import cv2
import numpy as np
import matplotlib.pyplot as plt
%matplotlib inline
img = cv2.imread('image0.jpg',1)
imgInfo = img.shape
height = imgInfo[0]
width = imgInfo[1]

# b通道概率
count_b = np.zeros(256,np.float)
count_g = np.zeros(256,np.float)
count_r = np.zeros(256,np.float)

# for循环遍历每一个点
for i in range(0,height):
    for j in range(0,width):
        (b,g,r) = img[i,j]
        index_b = int(b)
        index_g = int(g)
        index_r = int(r)
        count_b[index_b] = count_b[index_b]+1
        count_g[index_g] = count_g[index_g]+1
        count_r[index_r] = count_r[index_r]+1

# 计算概率
for i in range(0,256):
    count_b[i] = count_b[i]/(height*width)
    count_g[i] = count_g[i]/(height*width)
    count_r[i] = count_r[i]/(height*width)

# 画线,x轴坐标
x = np.linspace(0,255,256)
plt.figure(12)
y1 = count_b
plt.subplot(221)
plt.bar(x,y1,0.9,alpha=1,color='b')
y2 = count_g
plt.subplot(222)
plt.bar(x,y2,0.9,alpha=1,color='g')
y3 = count_r
plt.subplot(223)
plt.bar(x,y3,0.9,alpha=1,color='r')
plt.show()
cv2.waitKey(0)
不知道为啥颜色不对。
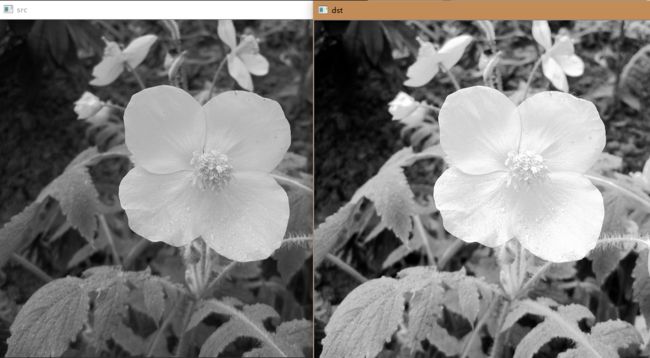
灰度直方图均衡化
# 直方图的本质:统计每个像素灰度 出现的概率 0-255 p(0-1)

# 直方图均衡化意思:

# 累计概率概念
# 第一个灰度等级出现概率 0.2  累积概率0.2
# 第二个灰度等级出现概率 0.3  累积概率0.5(0.2+0.3)
# 第三个灰度等级出现概率 0.1  累积概率0.6(0.5+0.1)
# 256个灰度等级,每个灰度等级都会有一个概率和一个累积概率
# 100这个灰度等级 它的累积概率0.5  255*0.5 = new 的值
# 可以得到100 到一个新的值的映射
# 之后所有灰度等级为100的由 255*0.5 作为替代

# 这个过程就叫做直方图的均衡化

import cv2
import numpy as np
import matplotlib.pyplot as plt
img = cv2.imread('image0.jpg',1)


imgInfo = img.shape
height = imgInfo[0]
width = imgInfo[1]

# 灰度化
gray = cv2.cvtColor(img,cv2.COLOR_BGR2GRAY)
cv2.imshow('src',gray)
count = np.zeros(256,np.float)
for i in range(0,height):
    for j in range(0,width):
        pixel = gray[i,j]
        index = int(pixel)
        count[index] = count[index]+1
# 计算灰度单个概率
for i in range(0,255):
    count[i] = count[i]/(height*width)

#计算累计概率
sum1 = float(0)
for i in range(0,256):
    sum1 = sum1+count[i]
    count[i] = sum1

# 此时的count 存放的是每个灰度等级对应的累积概率

# print(count)
# 计算映射表 数据类型为unit16
map1 = np.zeros(256,np.uint16)

for i in range(0,256):
    # 因为此时的count值为累积概率,乘以255为真实的映射值。
    map1[i] = np.uint16(count[i]*255)
# 完成映射
for i in range(0,height):
    for j in range(0,width):
        pixel = gray[i,j]
        # 映射表的下标通过当前灰度值取到映射值
        gray[i,j] = map1[pixel]
cv2.imshow('dst',gray)
cv2.waitKey(0)
彩色直方图均衡化
# 本质:统计每个像素灰度 出现的概率 0-255 p
# 累计概率
# 1 0.2  0.2
# 2 0.3  0.5
# 3 0.1  0.6
# 256
# 100 0.5 255*0.5 = new
# 1 统计每个颜色出现的概率 2 累计概率 1 3 0-255 255*p
# 4 pixel
import cv2
import numpy as np
import matplotlib.pyplot as plt
img = cv2.imread('image0.jpg',1)
cv2.imshow('src',img)

imgInfo = img.shape
height = imgInfo[0]
width = imgInfo[1]

# 三个count,分别描述颜色出现概率
count_b = np.zeros(256,np.float)
count_g = np.zeros(256,np.float)
count_r = np.zeros(256,np.float)
# 拿到所有像素中颜色值对应的个数
for i in range(0,height):
    for j in range(0,width):
        (b,g,r) = img[i,j]
        index_b = int(b)
        index_g = int(g)
        index_r = int(r)
        count_b[index_b] = count_b[index_b]+1
        count_g[index_g] = count_g[index_g]+1
        count_r[index_r] = count_r[index_r]+1
# 计算每个的出现概率
for i in range(0,255):
    count_b[i] = count_b[i]/(height*width)
    count_g[i] = count_g[i]/(height*width)
    count_r[i] = count_r[i]/(height*width)

# 计算累计概率
sum_b = float(0)
sum_g = float(0)
sum_r = float(0)
for i in range(0,256):
    sum_b = sum_b+count_b[i]
    sum_g = sum_g+count_g[i]
    sum_r = sum_r+count_r[i]
    count_b[i] = sum_b
    count_g[i] = sum_g
    count_r[i] = sum_r

#print(count)
# 计算映射表 三张
map_b = np.zeros(256,np.uint16)
map_g = np.zeros(256,np.uint16)
map_r = np.zeros(256,np.uint16)

# 创建三张映射表
for i in range(0,256):
    map_b[i] = np.uint16(count_b[i]*255)
    map_g[i] = np.uint16(count_g[i]*255)
    map_r[i] = np.uint16(count_r[i]*255)
# 映射
# 最终数据
dst = np.zeros((height,width,3),np.uint8)

# 读取每个点,进行映射
for i in range(0,height):
    for j in range(0,width):
        (b,g,r) = img[i,j]
        b = map_b[b]
        g = map_g[g]
        r = map_r[r]
        # 目标图片数据填充
        dst[i,j] = (b,g,r)
cv2.imshow('dst',dst)
cv2.waitKey(0)
mark
亮度增强
公式:
p = p + 40
简单的相加之后完成亮度增强。
# p = p + 40
import cv2
import numpy as np
img = cv2.imread('image0.jpg',1)
imgInfo = img.shape
height = imgInfo[0]
width = imgInfo[1]
cv2.imshow('src',img)

# 我们最终生成的图片数据
dst = np.zeros((height,width,3),np.uint8)
# 遍历图片中每个点
for i in range(0,height):
    for j in range(0,width):
        # 取出每个点的三个通道
        (b,g,r) = img[i,j]
        bb = int(b)+40
        gg = int(g)+40
        rr = int(r)+40
        # 判断不要越界
        if bb>255:
            bb = 255
        if gg>255:
            gg = 255
        if rr>255:
            rr = 255
        # 数据填入目标图片
        dst[i,j] = (bb,gg,rr)
cv2.imshow('dst',dst)
cv2.waitKey(0)
图片亮度确实提高了, 但是像是蒙上了一层白色的蒙版


