无人驾驶--实时定位与地图构建(SLAM)仿真与实战(附源码)
无人驾驶–实时定位与地图构建(SLAM)仿真与实战(附源码)
一个SLAM的技术小结,供自己回顾也为后人学习提供参考。
另外建了一个无人驾驶方面的微信交流群,有兴趣的同行或者专家学者可以加我微信:wxl609278502 请注明: 姓名-单位/学校/科研院所
项目技术描述
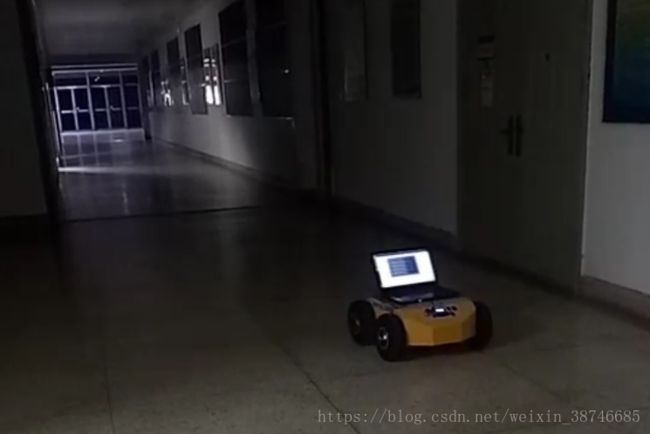
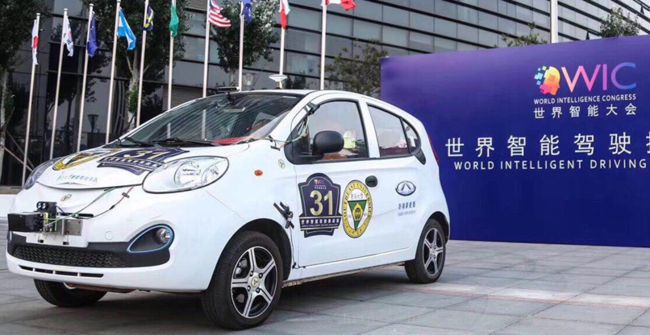
硬件平台:智能车平台、多线激光雷达、工控机、stm32、车身转角传感器和轮速传感器
软件平台:Ubuntu16.04、ROS
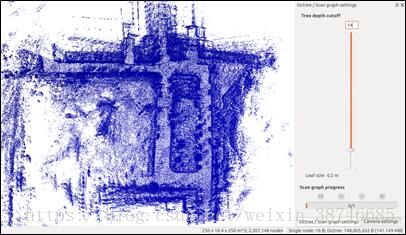
技术实现:通过激光雷达的点云数据和车身传感器数据,使用扩展卡尔曼滤波算法,实现实时定位与地图构建的matlab仿真验证与整车工程化实现(Ubuntu+ROS)。
SLAM概述
SLAM,全称是Simultaneous Localization and Mapping,即同时定位与建图。所以我们能看到SLAM的主要工作是定位以及建图。SLAM目前有很多实现方法,主要分为激光雷达和视觉传感器两个方向。。本文讨论的是激光雷达SLAM技术。
EKF 方法是解决 SLAM 问题的一种经典方法,其应用依赖于运动模型和观测模型的高斯噪声假设。在 SLAM 问题首次提出不久后,Smith 和 Cheesman及 Durrant-Whyte对机器人和路标间的几何不确定性关系进行了研究。Smith 等利用 EKF 方法提出的数学公式至今仍在广泛使用。基于 EKF 的 SLAM 方法提出后,许多研究者对该方法进一步改进,Moutarlier 等采用 EKF 方法实现了第一个 SLAM 系统。基于 EKF-SLAM 框架,一些研究人员在不同机器人系统上完成了许多开发工作。
EKF-SLAM 的主要优点是它能够以在线的方式估计地图的全后验概率。到目前为止,EKF(或其扩展方法,如高斯混合模型)方法和 RBPF(Rao-Blackwellized Particle Filte)方法是仅有的能够估计地图全后验概率的方法。估计全后验概率有很多优点:除了获得最可能的地图和机器人位姿,EKF 在地图中维护的不确定性在机器人利用地图导航的时候有极大的好处。除此以外,EKF可以使机器人位姿和所创建的环境地图依概率 1 收敛到真实值,其收敛程度由机器人初始不确定性和传感器观测的不确定性决定。
SLAM可以分为定位问题和建图问题:
定位问题:
- 已知路标的位置的地图m,
- 从无人车的位置得到路标的测量值Zk (距离和方位角),
- 根据路标的测量值Zk和路标的位置,计算出无人车的坐标Zk。
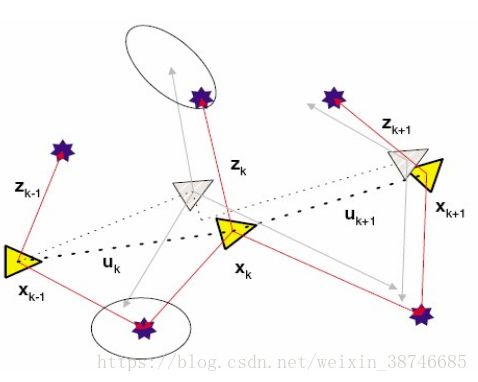
建图问题: - 提供车辆的坐标Xk,
- 通过激光雷达获得路标相对车辆的测量值Zk,
- 根据无人车的坐标Xk和路标的测量值Zk,计算路标的坐标,实现路标地图的构建。

定位与建图融合: - 定位与建图是一个耦合问题,可以从单次测量中推断出两个量,
- 只有同时考虑定位和建图的方案才能解决SLAM问题。
EKF-SLAM基本算法流程
1.车辆的预测模型(车辆运动学建模)
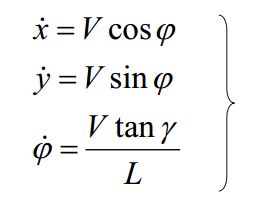
目标:根据车辆在时刻k的车速和方向盘转交V和y,估计车辆在k + 1 时刻的位置和航向角。具体模型和公式推导如下图所示。
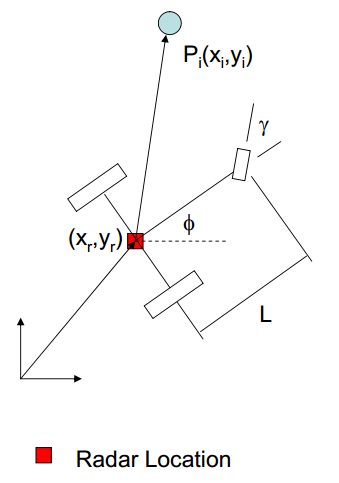
车辆运动学方程:
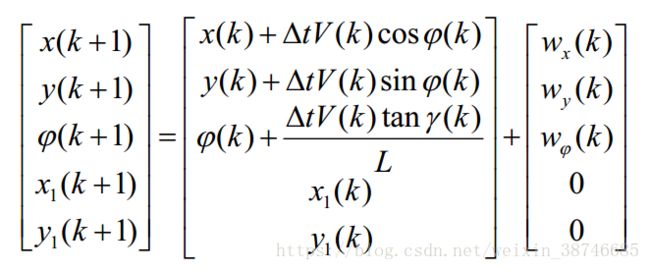
因此,车辆k+1时刻的预测方程为:

2.路标的预测模型
我们认定路标点的坐标相对地面坐标系是不变的,及k时刻和k+1时刻的路标点坐标位置一致。


3.整个系统(车辆预测+路标预测)的预测方程
4.观测模型

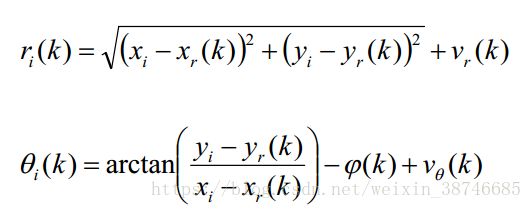
本实验中使用的激光雷达返回的是障碍物的距离和角度,因此观测方程需要从笛卡尔坐标系转换到极坐标系,因此观测方程如下所示:
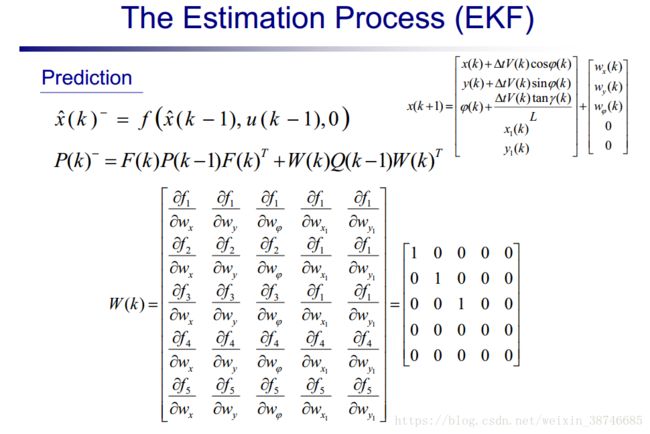
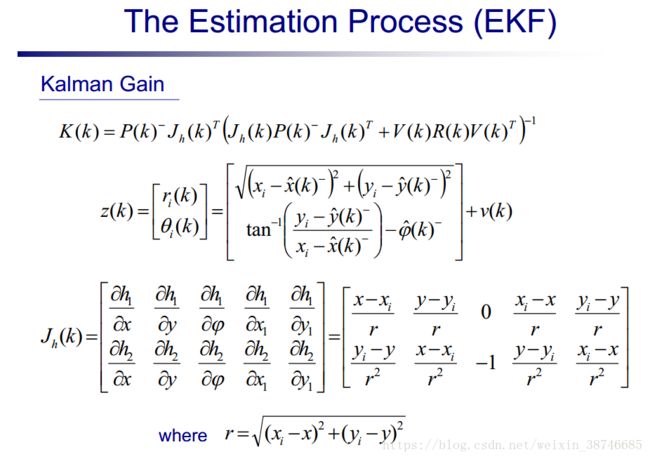
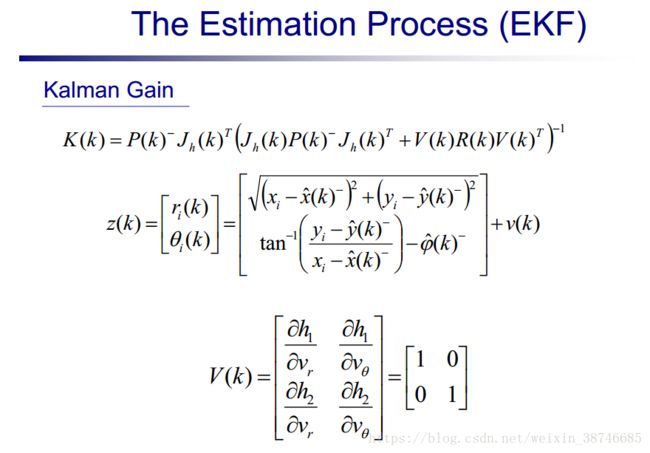
5.EKF公式推导(直接上ppt,卡尔曼算法原理不清楚的就去查论文吧)
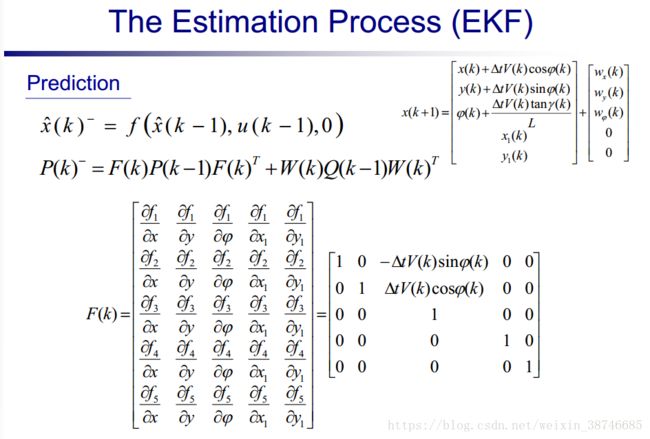
四轮智能车SLAM实际配置
1.车辆建模
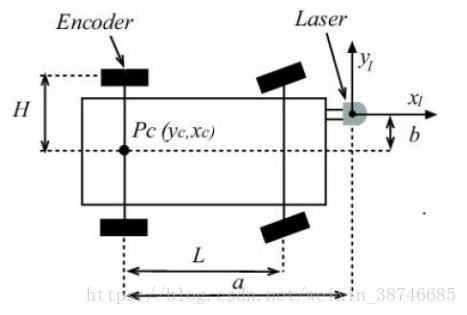
运动学方程
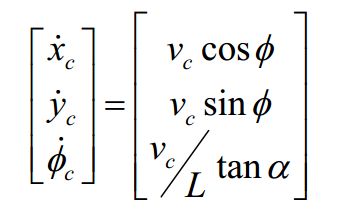
将我们的车辆坐标转换为激光雷达安装点的坐标,并进行微分。

车辆参数相对k时刻到k+1时刻的预测方程

因为车速Vc是通过轮速传感器Ve进行的测量,需要进行换算
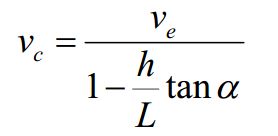
2.计算以预测方程的雅可比矩阵
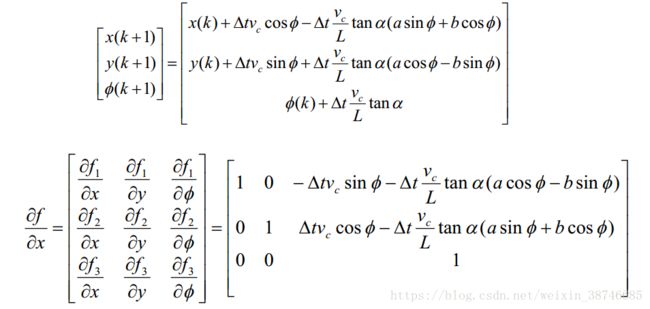
3.传感器观测模型
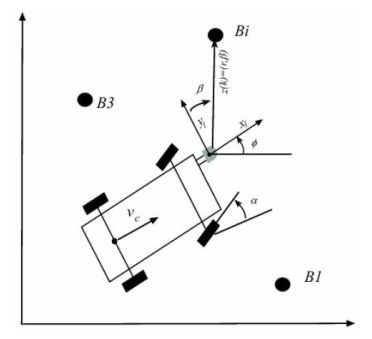
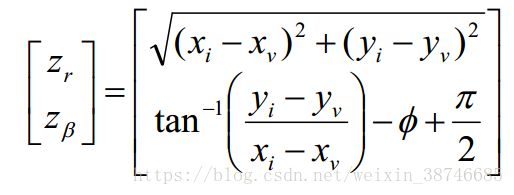
其中,Xi,Yi是路标点的坐标。
4.计算以观测方程的雅可比矩阵

5.初始化
初始化0时刻的车辆状态向量

初始化协方差矩阵

初始化预测方程的噪声矩阵和观测方程的噪声矩阵
6. 扩展卡尔曼计算流程
计算预测协方差矩阵

更新状态向量和协方差矩阵

仿真源码
主程序:
%-------------------------------------------------------------------------
% FILE: SEU_slam_wxl.m
% DESC: Implements the SLAM algorithm based on a robot model and sensor
%       data from Nebot.
%landmarks(真实路标)
%estbeac=estimation(估计)+beacon(路标),将estbeac的值赋给landmarks然后将estbeac清除。
%xest                                   状态矩阵
%Pest                                   协方差矩阵
%A W Jh                                 雅可比矩阵
%Q                                      过程激励噪声协方差矩阵
%k                                      迭代次数
%K                                      卡尔曼增益
%numStates                              状态的数量  初始化时候就三个,即位置(x,y)和姿态(phi)
%phi                                    姿态,即与x轴的夹角
%Steering                               转向角
%alpha                                  转向角
%Ve = Velocity                          后轮的转速
%Vc                                     车水平平移速度
%zlaser=[rangeArray; bearingArray];     机器人与路标的距离和方位
%--------------------------------------------------------------------------
clear all; clc;
load('data_set');
load('beac_juan3.mat');   %beac_juan3.mat中内容为路标,命令whos –file查看该文件中的内容
landmarks=estbeac; clear estbeac; % true landmark positions (measured w/GPS sensor)
%---------------------  DATA INITIALIZATION   -----------------------------
% Vehicle constants
L=2.83;     % distance between front and rear axles(前后轮轴之间的距离)
h=0.76;     % distance between center of rear axle and encoder(后轮轴中心与编码器的距离)
b=0.5;      % vertical distance from rear axle to laser(后轮轴中心到激光传感器的垂直距离)
a=3.78;     % horizontal distance from rear axle to laser(后轮轴中心到激光传感器的水平距离)

% EKF components used in multiple functions
global xest Pest A Q W   %定义全局变量
global numStates k
xest = zeros(3,1);  % state matrix
Pest = zeros(3,3);  % covariance matrix2
numStates=3;        % initially, there are no landmarks(i.e. the number of value in the state matrix)

% matrixes initialization
A = zeros(3,3);                 % process model jacobian
W = eye(3);                     % process noise jacobian
Q = [.49   0   0; 0 .49 0; 0 0 (7*pi/180)^2];
Jh = zeros(2,3);                % sensor model jacobian
K = zeros(3,3);                 % kalman gain

% initialize time
To = min([TimeGPS(1),Time_VS(1),TimeLaser(1)]); % data starts being collected at 45 secs for some reason??
Time = Time - To;
t=Time(1);
tfinal = 112;   % there is 112 seconds worth of data
k=1;            % loop iteration counter(循环迭代计数)

% initialize estimates
xest(1,1) = GPSLon(1);      % x position of vehicle
xest(2,1) = GPSLat(1);      % y position of vehicle
xest(3,1) = -126*pi/180;    % phi of vehicle       % LB(?):how to get this value?
Pest(:,:) = [0.1, 0, 0; 0, 0.1, 0; 0, 0, 15*pi/180];

% initial inputs
alpha = Steering(1);    % measured steering angle(测量转向角)
Ve = Velocity(1);       % measured velocity at back wheel(测量后轮速率)
Vc = Velocity(1) / (1 - (h/L)*tan(alpha));  % measured velocity transformed to vehicle center
%--------------------- end of DATA INITIALIZATION  ------------------------


disp('Running through Kalman filter...');


n_dsp = 0;
%------------------  EXTENDED KALMAN FILTER PROCEDURE  --------------------
while t3)
        for i=4:numStates
            xest(i,k)= xest(i,k-1);
        end
    end

    % Calculate Jacobian A based on vehicle model (df/dx)
    A(1,1)=1; A(1,2)=0; A(1,3) = -dt*Vc*sin(phi) - dt*Vc/L*tan(alpha)*(a*cos(phi)-b*sin(phi));
    A(2,1)=0; A(2,2)=1; A(2,3) = dt*Vc*cos(phi) - dt*Vc/L*tan(alpha)*(a*sin(phi)+b*cos(phi));
    A(3,1)=0; A(3,2)=0; A(3,3)=1;
    % rest of A (which is just 2 null matrices and 1 identity) is added in new_state function

    % Calculate prediction for covariance matrix
    Pest = A*Pest*A' + W*Q*W';      %(公式2)

    % Check to see if new velocity and steering measurements are available
    if Sensor(k)==2   % encoders(编码器) are sensor #2
        Ve = Velocity(Index(k));
        alpha = Steering(Index(k));
        Vc = Ve / (1-(h/L)*tan(alpha));
    end

    % Check to see if new laser(激光) data is available
    if (Sensor(k)==3 && t>1)   % SICK is sensor #3

        % from a single 180 degree scan, determine # of landmarks & center of each landmark
        [rangeArray bearingArray] = getLandmarkCenter(Laser(Index(k),:), Intensity(Index(k),:));
        zlaser=[rangeArray; bearingArray];          % range/bearing data in observation model format
        numLandmarks = size(rangeArray,2);          % number of LMs captured in a single scan

        for i=1:numLandmarks                            % for i = 1 to # of landmakrs picked up in single scan
            if(numStates==3)                            % if 1st observed landmark, update state and covariance
                new_state(zlaser(:,i));                 % add new state (i.e. increase all matrix sizes)
                numStates = numStates + 2;              % increase number of states by 2 (1 for xi, 1 for yi)
                [xest,Pest] = updateNew(zlaser(:,i));   % update state and covariance
            else                                        % not 1st landmark -> check to make sure no LMs in range
                [dist,index]=nearby_LMs(zlaser(:,i));   % dist from observation to already incorporated LMs (< 3m)
                min_dist = 2;                           % minimum distance between landmark and observation
                if dist>min_dist                        % if dist to nearby_LM is > "min_dist", add observation as new LM
                    new_state(zlaser(:,i));             % add new state (i.e. increase all matrix sizes)
                    numStates = numStates + 2;          % increase number of states by 2 (1 for xi, 1 for yi)
                    [xest,Pest] = updateNew(zlaser(:,i));               % update state and covariance
                else                                                    % else find closest LM and associate
                    closest = 4 + 2*(index-1);                          % find LM which is closest to observation
                    [xest,Pest] = updateExisting(zlaser(:,i),closest);  % update state and covariance
                end
            end
        end
    end
    % LB_add: display information
    if( floor(t/tfinal*100) > n_dsp)
        clc;
        n_dsp = floor(t/tfinal*100);
        str = sprintf('运行卡尔曼滤波... [%d%c]', n_dsp,'%');
        disp(str);
    end
end  % end while
%-------------- end of  EXTENDED KALMAN FILTER PROCEDURE -----------------

%--------------------------- PLOT RESULTS --------------------------------
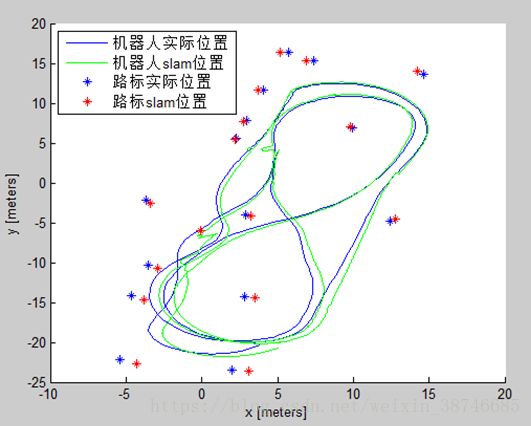
figure(1); hold on;
plot(GPSLon(1:560),GPSLat(1:560));          % robot position (true)
plot(xest(1,1:k),xest(2,1:k),'g');          % robot position (model)
plot(landmarks(:,1),landmarks(:,2),'*');    % landmark position (true)
for i=4:2:numStates
    plot(xest(i,k),xest(i+1,k),'r*');     % landmark position (model)
end
legend('机器人实际位置','机器人slam位置','路标实际位置','路标slam位置',2);
xlabel('x [meters]'); ylabel('y [meters]');
axis([-10 20 -25 20]);

%% Estimate error(估计误差)
x_error1 = GPSLon(1:560)-xest(1,1:560);
x_error2 = GPSLat(1:560)-xest(2,1:560);
for i=4:2:numStates
    landmarks_error1=landmarks(:,2)-xest(i+1,k);
end
for i=4:2:numStates
    landmarks_error2=landmarks(:,1)-xest(i,k);
end
%% Graph 2
figure(2)
plot(x_error1),grid on;
title('机器人位置误差 on X axis')
xlabel('时间 [sec]')
ylabel('位置均方根误差 [m]')
axis([0 112 -25 25]);
hold off;
%% Graph 3
figure(3)
plot(x_error2),grid on;
title('机器人位置误差 on Y axis')
xlabel('时间 [sec]')
ylabel('位置均方根误差 [m]')
axis([0 112 -25 25]);
hold off;
%% Graph 4
figure(4)
plot(landmarks_error1),grid on;
title('路标位置误差 on x axis')
xlabel('时间 [sec]')
ylabel('位置均方根误差 [m]')
axis([0 18 -25 25]);
hold off;
%% Graph 5
figure(5)
plot(landmarks_error2),grid on;
title('路标位置误差 on Y axis')
xlabel('时间 [sec]')
ylabel('位置均方根误差 [m]')
axis([0 18 -25 25]);
hold off;
%------------------------ end of PLOT RESULTS -----------------------------
子函数getLandmarkCenter.m
% Based on range and intensity values from SICK scanner, determine center of landmark.
% Landmarks are assumed to be reflectors and therefore generate a high intensity value.
function [landmarkRange,landmarkBearing]=getLandmarkCenter(laser,intensity)
    landmarkRange = [];
    landmarkBearing = [];
    maxRange = 30;
    range = 0;
    bearing = 0;
    count = 0;

    for i=1:361 % for i = 1 to 180 degrees at 0.5 degree resolution
        if( laser(i)0)
            range = range + laser(i);   % keep running count of range values
            bearing = bearing + i;      % keep running count of bearing values
            count = count + 1;          % keep running count to calculate average

            % check next 3 intensity values...if all zero, then calculate landmark center
            bound = 361 - i;
            val_1 = min(1,bound);       % if i=361, then bound equals 0
            val_2 = min(2,bound);       % if i=360, then val_1, val_2, & val_3 all equal 1...otherwise val_2=2
            val_3 = min(3,bound);       % if i=359, then val_1=1, val_2 & val_3 equal 2...otherwise val_3=3
            if( intensity(i+val_1)==0 & intensity(i+val_2)==0 & intensity(i+val_3)==0 || bound==0)
                range = range/count;                            % calculate range to landmark center
                bearing = bearing/count;                        % calculate bearing to landmark center
                bearing = (bearing-1)/2*(pi/180);               % bearing is from 0:180 with 0.5 deg resolution
                landmarkRange = [landmarkRange range];          % form 1D array of range vals for every LM observed
                landmarkBearing = [landmarkBearing bearing];    % form 1D array of bearing vals for every LM observed
                range = 0; bearing = 0; count = 0;              % reset all variables
            end
        end
    end
return;
子函数nearby_LM.m
% Determines the distance between the current observation and every landmark currently
% in the state vector.  Then returns the distance and index of the closest landmark.
function   [dist,index] = nearby_LMs(zlaser);

    global xest;
    global numStates;
    global k;

    ii = [4:2:numStates-1];                                   % landmarks in state vector (i.e. if 3 LMs, then ii=4:2:8)
    theta = zlaser(2,1) + xest(3,k) - pi/2;
    xx = xest(1,k) + zlaser(1,1)*cos(theta); % x position of observation
    yy = xest(2,k) + zlaser(1,1)*sin(theta); % y position of observation
    d = ((xx-xest(ii,k)).^2 + (yy-xest(ii+1,k)).^2).^0.5;       % row vect of dist from observed LM to LMS in 3m area
                                                            % if 3 LMs, then d = [d1 d2 d3]

    [dist,index] = min(d);  % find LM closest to observation and return distance
    clear xx yy;
return;
子函数new_state.m
% When new landmark is added to state vector, all matrices have to be
% updated.  This includes xest, Pest, A, Q, and W.
function new_state(zlaser)

    global xest;        % state matrix
    global Pest;        % covariance matrix
    global numStates;   % number of states before entering this loop
    global A Q W k

    % Calculate landmark position in global frame
    theta = zlaser(2,1) + xest(3,k) - pi/2;
    x = xest(1,k) + zlaser(1,1)*cos(theta);     % x-position of landmark in global frame
    y = xest(2,k) + zlaser(1,1)*sin(theta);     % y-position of landmark in global frame

    xest = [xest; zeros(2,length(xest))];   % add 2 rows of zeros to xest
    xest(numStates+1,k) = x;                % add estimate of x-pos of landmark
    xest(numStates+2,k) = y;                % add estimate of y-pos of landmark
    clear x y;

    Pest(numStates+1,1:(numStates)) = 0;    % x row
    Pest(1:numStates,numStates+1) = 0;      % x column
    Pest(numStates+1,numStates+1) = 10^6;   % x diagonal

    Pest(numStates+2,1:(numStates+1)) = 0;  % y row
    Pest(1:numStates+1,numStates+2) = 0;    % y column
    Pest(numStates+2,numStates+2) = 10^6;   % y diagonal  (this may introduce numerical problems if not choosen properly)


    A = [A, zeros(numStates,2)];            % make top right of Jacobian null matrix
    A = [A; zeros(2,numStates+2)];          % make bottom of Jacobian null matrix
    A(numStates+1,numStates+1)=1;           % make bottom right of Jacobian identity
    A(numStates+2,numStates+2)=1;           % make bottom right of Jacobian identity

    Q = [Q, zeros(numStates,2)];
    Q = [Q; zeros(2,numStates+2)];
    W = [W, zeros(numStates,2)];
    W = [W; zeros(2,numStates+2)];

return;
子函数normallizeAngle.m
% This function was copied from Nebot's code.  It is used to keep the angle
% between -180 and 180 degrees.
function ang2 = normalizeAngle(ang1)
    if ang1>pi, ang2 =ang1-2*pi ;  return ; end ;
    if ang1<-pi, ang2 =ang1+2*pi ;  return ; end ;
    ang2=ang1;
return
