API详解:sklearn.linear_model.LinearRegression
基于最小二乘法的线性回归。非常基础。那么相应的API 的调用参数有哪些呢?
调用方法: 老套路,先定义一个线性回归对象
lr = sklearn.linear_model.LinearRegression(fit_intercept=True, normalize=False, copy_X=True, n_jobs=1)
fit_intercept : 默认为True,是否计算该模型的截距。如果使用中心化的数据,可以考虑设置为False,不考虑截距。注意这里是考虑,一般还是要考虑截距
normalize: 默认为false. 当fit_intercept设置为false的时候,这个参数会被自动忽略。如果为True,回归器会标准化输入参数:减去平均值,并且除以相应的二范数。当然啦,在这里还是建议将标准化的工作放在训练模型之前。通过设置sklearn.preprocessing.StandardScaler来实现,而在此处设置为false
copy_X : 默认为True, 否则X会被改写
n_jobs: int 默认为1. 当-1时默认使用全部CPUs ??(这个参数有待尝试)
可用属性:
coef_:训练后的输入端模型系数,如果label有两个,即y值有两列。那么是一个2D的array
intercept_: 截距
可用的methods:
fit(X,y,sample_weight=None):
X: array, 稀疏矩阵 [n_samples,n_features]
y: array [n_samples, n_targets]
sample_weight: 权重 array [n_samples]
在版本0.17后添加了sample_weight
get_params(deep=True): 返回对regressor 的设置值
predict(X): 预测 基于 R^2值
score: 评估
下面用个例子:从数据产生,到数据提取,数据标准化,模型训练和评估来说明各个API的调用过程
import sklearn
from sklearn.preprocessing import StandardScaler
from sklearn.linear_model import LinearRegression
from sklearn.model_selection import train_test_split
import matplotlib as mpl
import matplotlib.pyplot as plt
import numpy as np
import pandas as pd

## 设置字符集,防止中文乱码
mpl.rcParams['font.sans-serif']=[u'simHei']
mpl.rcParams['axes.unicode_minus']=False

# 定义目标函数通过改函数产生对应的y
# y=1*x[0]+2*x[1]+....(n+1)*x[n]
def l_model(x):
    params = np.arange(1,x.shape[-1]+1)
    y = np.sum(params*x)+np.random.randn(1)*0.1
    return y

# 定义数据集
x = pd.DataFrame(np.random.rand(500,6))
y = x.apply(lambda x_rows:pd.Series(l_model(x_rows)),axis=1)

# 划分训练集和测试集
x_train,x_test,y_train,y_test = train_test_split(x,y,test_size=0.3,random_state=2)

# 数据标准化
ss = StandardScaler()
x_train_s = ss.fit_transform(x_train)
x_test_s = ss.transform(x_test)

# 输出下原数据的标准差和平均数
print(ss.scale_)
print(ss.mean_)

"""
输出为:
[ 0.29120331  0.28542949  0.27555607  0.29077365  0.29265191  0.27455333]
[ 0.48993661  0.5081563   0.49650784  0.51339497  0.52648792  0.49551893]
"""

# 训练模型
lr = LinearRegression()
lr.fit(x_train_s,y_train)

print(lr.coef_)
print(lr.intercept_)

"""
[[ 0.29420892  0.56808491  0.83138528  1.1669219   1.45715988  1.64179749]]
[ 10.65847455]
"""

# 用模型预测
y_predict=lr.predict(x_test_s)
lr.score(x_test_s,y_test)

"""
0.99820653306043794
"""

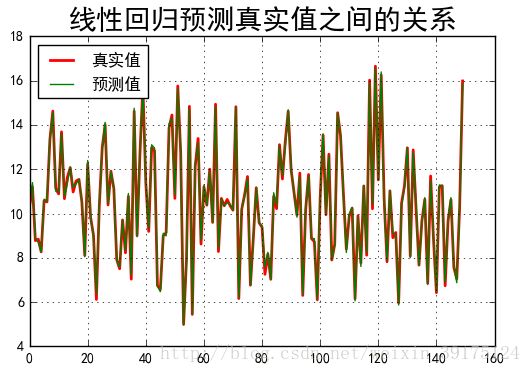
## 预测值和实际值画图比较
t=np.arange(len(x_test_s))
plt.figure(facecolor='w')#建一个画布,facecolor是背景色
plt.plot(t, y_test, 'r-', linewidth=2, label='真实值')
plt.plot(t, y_predict, 'g-', linewidth=1, label='预测值')
plt.legend(loc = 'upper left')#显示图例,设置图例的位置
plt.title("线性回归预测真实值之间的关系", fontsize=20)
plt.grid(b=True)#加网格
plt.show()