机器学习(matplotlib库)详解
注:在jupyter中进行展示(每一段代码对应一个标签)
import matplotlib.pyplot as plt
import numpy as np
%matplotlib inline#如果图形没有出现,加上这一行
x = np.linspace(-10,10)#通过在-10 - 10间随机的创建数据
x,x.shape

(array([-10.        ,  -9.59183673,  -9.18367347,  -8.7755102 ,
         -8.36734694,  -7.95918367,  -7.55102041,  -7.14285714,
         -6.73469388,  -6.32653061,  -5.91836735,  -5.51020408,
         -5.10204082,  -4.69387755,  -4.28571429,  -3.87755102,
         -3.46938776,  -3.06122449,  -2.65306122,  -2.24489796,
         -1.83673469,  -1.42857143,  -1.02040816,  -0.6122449 ,
         -0.20408163,   0.20408163,   0.6122449 ,   1.02040816,
          1.42857143,   1.83673469,   2.24489796,   2.65306122,
          3.06122449,   3.46938776,   3.87755102,   4.28571429,
          4.69387755,   5.10204082,   5.51020408,   5.91836735,
          6.32653061,   6.73469388,   7.14285714,   7.55102041,
          7.95918367,   8.36734694,   8.7755102 ,   9.18367347,
          9.59183673,  10.        ]), (50,))
y = np.linspace(-1,1)
y,y.shape

(array([-1.        , -0.95918367, -0.91836735, -0.87755102, -0.83673469,
        -0.79591837, -0.75510204, -0.71428571, -0.67346939, -0.63265306,
        -0.59183673, -0.55102041, -0.51020408, -0.46938776, -0.42857143,
        -0.3877551 , -0.34693878, -0.30612245, -0.26530612, -0.2244898 ,
        -0.18367347, -0.14285714, -0.10204082, -0.06122449, -0.02040816,
         0.02040816,  0.06122449,  0.10204082,  0.14285714,  0.18367347,
         0.2244898 ,  0.26530612,  0.30612245,  0.34693878,  0.3877551 ,
         0.42857143,  0.46938776,  0.51020408,  0.55102041,  0.59183673,
         0.63265306,  0.67346939,  0.71428571,  0.75510204,  0.79591837,
         0.83673469,  0.87755102,  0.91836735,  0.95918367,  1.        ]),
 (50,))
plt.plot(x,y)
y = np.sin(x)
y,y.shape

(array([ 0.54402111,  0.16628279, -0.23877532, -0.60460332, -0.8710967 ,
        -0.99447137, -0.9544572 , -0.75762842, -0.43632343, -0.04333173,
         0.35677924,  0.6982724 ,  0.92504137,  0.99982867,  0.91034694,
         0.67129779,  0.32195632, -0.08028167, -0.46932961, -0.78126802,
        -0.96484631, -0.98990308, -0.85232157, -0.57470604, -0.20266794,
         0.20266794,  0.57470604,  0.85232157,  0.98990308,  0.96484631,
         0.78126802,  0.46932961,  0.08028167, -0.32195632, -0.67129779,
        -0.91034694, -0.99982867, -0.92504137, -0.6982724 , -0.35677924,
         0.04333173,  0.43632343,  0.75762842,  0.9544572 ,  0.99447137,
         0.8710967 ,  0.60460332,  0.23877532, -0.16628279, -0.54402111]),
 (50,))
plt.plot(x,y)
x = np.arange(5)#从0开始的5个索引号
x,x.shape

(array([1, 3, 4, 4, 3]), (5,))
plt.plot(x,y)
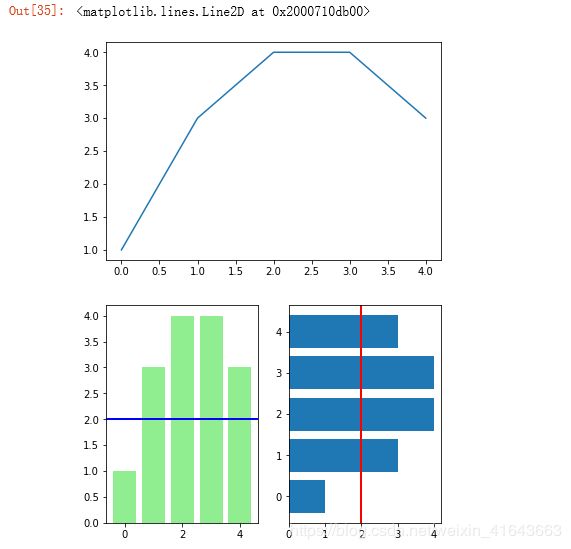
fig,axes = plt.subplots(ncols=2)#分为两列
v_bars = axes[0].bar(x,y,color = 'lightgreen')#纵向的柱形图
h_bars = axes[1].barh(x,y)#横向的条形图
axes[0].axhline(2,color='blue',linewidth=2)#画出一条等高线
axes[1].axvline(2,color='red',linewidth=2)#画出一条等高线
# fig,ax = plt.subplots(nrows = 2)#分为两行
fig,ax = plt.subplots()
v_bars = ax.bar(x,y,color = 'lightblue')
for bar,height in zip(v_bars,y):#zip表示将两个元组进行组合
    if height < 2:
        bar.set(edgecolor = 'darkred',color = 'lightgreen',linewidth = 3)
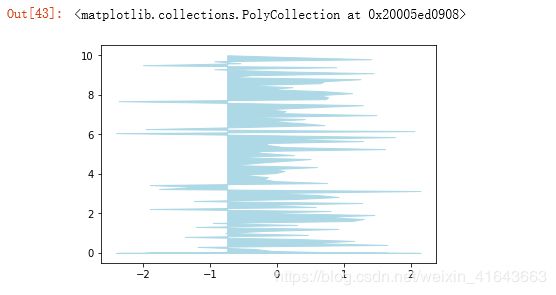
x = np.random.randn(100)#根据标准正态分布:期望为0,方差为1,随机生成100个数
y= np.linspace(0,10,100)
fig,ax = plt.subplots()#生成画布,可以在括号中添加参数
# plt.plot(x,y)
ax.fill_between(x,y,color = 'lightblue')#fill_between是将生成的地方进行填充,看不懂就看下面的图
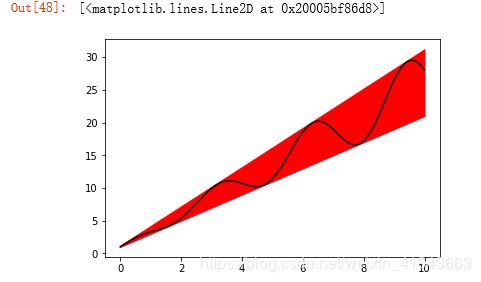
x = np.linspace(0,10,200)
y1 = 2 * x + 1
y2 = 3 * x + 1.2
fig,ax = plt.subplots()
ax.fill_between(x,y1,y2,color = 'red')

y_mean = 0.5 * x * np.cos(x * 2) + 2.5*x + 1
ax.plot(x,y_mean,color = 'black')
mean_values = [1,2,3]#均值
variance = [0.2,0.4,0.5]#方差
bar_label = ['bar1','bar2','bar3']
x_pos = list(range(len(bar_label)))#给x轴顶一下坐标
x_pos

[0, 1, 2]
plt.bar(x_pos,mean_values,yerr = variance,alpha=0.3)#alpha透明度,yerr方差
max_y = max(zip(mean_values,variance))
max_y
plt.ylim([0,(max_y[0]+max_y[1])*1.3])#设置y轴的区间
plt.ylabel('variable y')#纵坐标的名称
plt.xlabel('variable x')#横坐标的名称
plt.xticks(x_pos,bar_label)#将x轴的0,1,2换成bar1,bar2,bar3
两组数据
x1 = np.array([1,2,3])
x1

array([1, 2, 3])
x2 = np.array([2,2,3])
x2

array([2, 2, 3])
bar_label = ['bar1','bar2','bar3']

#plt.figure和plt.subplots都可以给出一个画布
#figsize参数:指定绘图对象的宽度和高度,单位为英寸
#dpi参数:指定绘图对象的一个分辨率,即每个英寸是多少个像素点,默认等于80
#所以下面的例子中创建的图标宽度为80*8=640像素
plt.figure(figsize=(8,6))
y_pos = np.arange(len(x1))
y_pos
plt.barh(y_pos,x1,color='lightblue',alpha=0.5)

plt.barh(y_pos,-x2,color='b',alpha=0.5)

plt.xlim(-max(x2)-0.5,max(x1)+0.5)#设置x轴的极限
# plt.xlim(-4,len(x1)+1)#和上面的结果是一样的
三组数据
green_data = [1,2,3]
blue_data = [3,2,1]
red_data = [2,3,3]
labels = ['group1','group2','group3']
pos = list(range(len(green_data)))

width = 0.2
fig,ax = plt.subplots(figsize=(8,6))
plt.bar([p-width for p in pos],green_data,width=width,alpha=0.5,color='g',label=labels[0])
plt.bar(pos,blue_data,width=width,alpha=0.5,color='b',label=labels[1])
plt.bar([p+width for p in pos],red_data,width=width,alpha=0.5,color='r',label=labels[1])
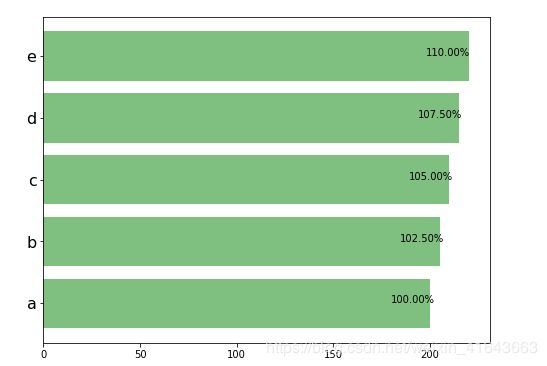
data = range(200,225,5)
bar_labels = ['a','b','c','d','e']
fig = plt.figure(figsize=(8,6))
y_pos = np.arange(len(data))

bars = plt.barh(y_pos,data,alpha=0.5,color='g')
plt.yticks(y_pos,bar_labels,fontsize=16)

for bar,d in zip(bars,data):
    #{:.2%}'.format(d/min(data))保留两位小数.2%
    plt.text(bar.get_width()-bar.get_width()*0.1,bar.get_y()+bar.get_height()/2,'{:.2%}'.format(d/min(data)))
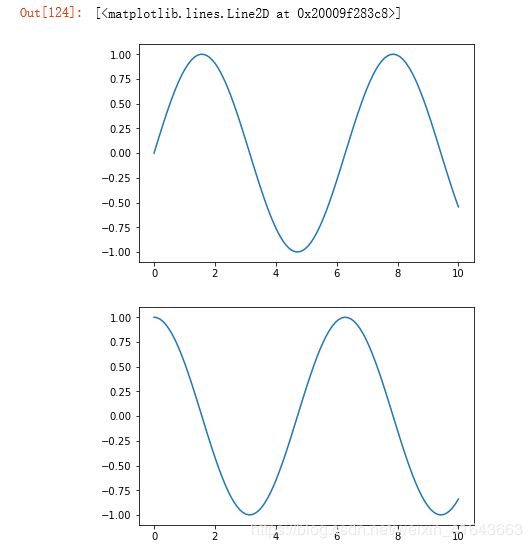
一张图里画两条线
x = np.linspace(0,10,100)
plt.plot(x,np.sin(x))
plt.plot(x,np.cos(x))
分别生成两张图来画
x = np.linspace(0,10,100)
fig1 = plt.figure('sin')
plt.plot(x,np.sin(x))
fig2 = plt.figure('cos')#给这幅图定义一个名字
plt.plot(x,np.cos(x))
保存画的图
fig1.savefig('sin')
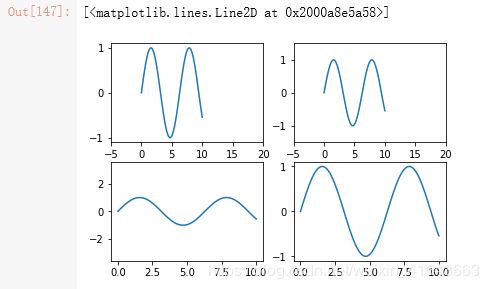
画多张子图
x = np.linspace(0,10,100)
fig1 = plt.figure()
plt.subplot(2,2,1)
#分别定义画图的x轴和y轴的区间长度
plt.xlim(-5,20)
plt.plot(x,np.sin(x))

plt.subplot(2,2,2)
#直接用axis定义画图的x轴和y轴范围
plt.axis([-5,20,-1.5,1.5])
plt.plot(x,np.sin(x))

plt.subplot(2,2,3)
plt.axis([-5,20,-1.5,1.5])
plt.axis('equal')#保证饼状图为正圆 ,将坐标轴平均一下
plt.plot(x,np.sin(x))

plt.subplot(2,2,4)
plt.plot(x,np.sin(x))
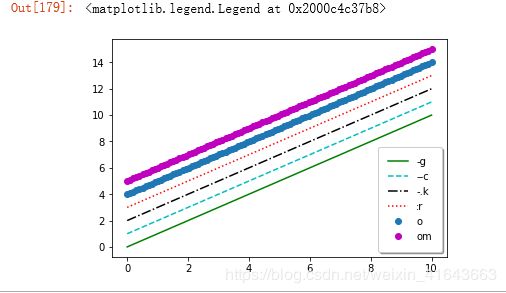
画不同种的线
x = np.linspace(0,10,100)
plt.plot(x,x+0,'-g',label='-g')
plt.plot(x,x+1,'--c',label='--c')#虚线
plt.plot(x,x+2,'-.k',label='-.k')
plt.plot(x,x+3,':r',label=':r')
plt.plot(x,x+4,'o',label='o')
plt.plot(x,x+5,'om',label='om')
#加图例,并加上一些效果
# plt.legend()#默认左上角
plt.legend(loc='lower right',fancybox=True,shadow=True,borderpad=True,framealpha=1)#右下角
画散点图
x = np.linspace(0,10,50)
plt.subplot(1,2,1)
plt.plot(x,np.sin(x),'o')
plt.subplot(1,2,2)
plt.scatter(x,np.sin(x))#scatter就是表示散点图
#plot的画图的执行速度是由于scatter的,原因是scatter里面的每个点是可以分别设置的

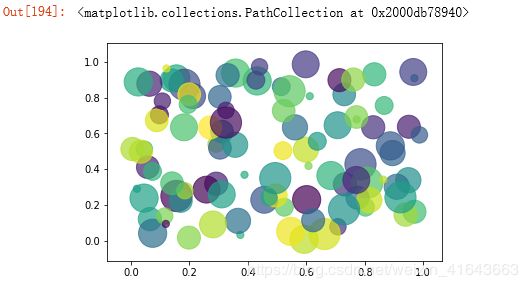
scatter里面的一些有意思的参数,scatter画散点图的时候可以每个点有一个独立的参数,但是系统开销会变大
np.random.seed(42)#随机数种子,后面的数字随即便取,只是起始位置不相同而已
x = np.random.rand(100)
y = np.random.rand(100)
colors = np.random.rand(100)

#画10种大小不同的点
size = np.random.rand(10)*1000
plt.scatter(x,y,c = colors,s=size,alpha=0.7)
画等高线
a = np.array([1,2,3])
b = np.array([7,8])#少的为行,多的为列
c,d = np.meshgrid(a,b)
c,d

(array([[1, 2, 3],
        [1, 2, 3]]), array([[7, 7, 7],
        [8, 8, 8]]))
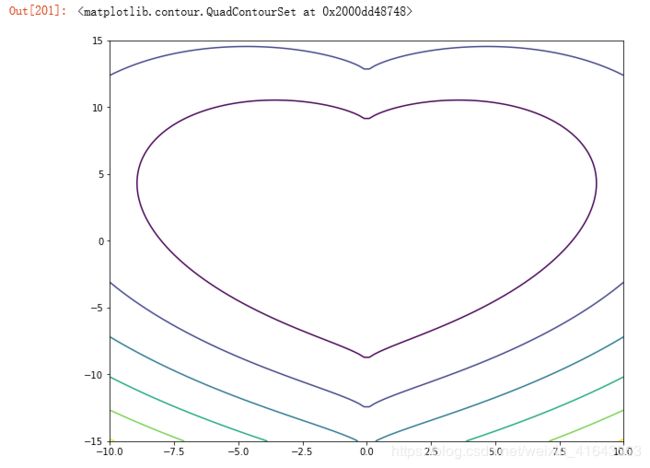
x = np.linspace(-10,10,100)
y = np.linspace(-15,15,100)

def f(x,y):
    return x**2 + (y-np.cbrt(x**2))**2
X,Y = np.meshgrid(x,y)
X,Y
Z = f(X,Y)#函数X,Y,Z
plt.figure(figsize=(10,8))
# plt.contour(X,Y,Z,colors='red')#利用contour画等高线
plt.contour(X,Y,Z)#采用默认的颜色
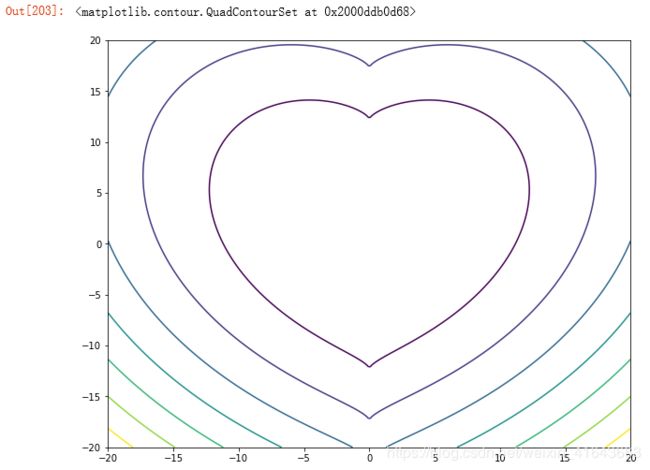
x = np.linspace(-20,20,300)
y = np.linspace(-20,20,300)

def f(x,y):
    return x**2 + (y-np.cbrt(x**2))**2
X,Y = np.meshgrid(x,y)
X,Y
Z = f(X,Y)#函数X,Y,Z
plt.figure(figsize=(10,8))
plt.contour(X,Y,Z)#采用默认的颜色
频次直方图
#取0到1里面的均匀分布
x = np.random.random(1000)#本质上和rand没有区别,前者是int类型,后者是longint类型
plt.hist(x)

(array([105.,  96.,  87.,  92., 106., 116., 100., 102., 110.,  86.]),
 array([5.54184585e-04, 1.00479281e-01, 2.00404376e-01, 3.00329472e-01,
        4.00254568e-01, 5.00179664e-01, 6.00104760e-01, 7.00029856e-01,
        7.99954952e-01, 8.99880048e-01, 9.99805144e-01]),
 )
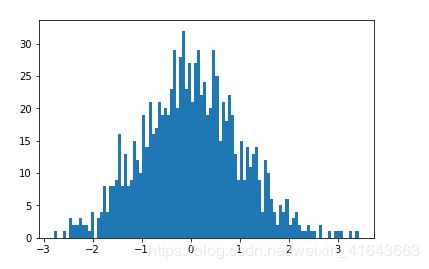
x = np.random.randn(1000)
#默认的bins(箱子)是10,也就是默认的条状图的根数
# plt.hist(x)
plt.hist(x,bins=100)

(array([ 1.,  0.,  0.,  1.,  0.,  3.,  2.,  2.,  3.,  2.,  2.,  1.,  4.,
         0.,  3.,  4.,  8.,  4.,  8.,  8.,  9., 16.,  8., 13.,  8.,  9.,
        15., 12., 10., 19., 14., 21., 16., 17., 21., 19., 20., 19., 23.,
        29., 20., 28., 32., 23., 27., 21., 27., 29., 22., 24., 19., 20.,
        29., 25., 15., 21., 18., 22., 19., 13.,  9., 15.,  9., 14., 11.,
        13., 14.,  9.,  4., 12., 10.,  6.,  4.,  2.,  5.,  4.,  6.,  2.,
         3.,  4.,  2.,  1.,  1.,  2.,  1.,  1.,  0.,  2.,  0.,  0.,  1.,
         0.,  1.,  1.,  1.,  0.,  0.,  1.,  0.,  1.]),
 array([-2.78296043, -2.72084172, -2.65872301, -2.59660431, -2.5344856 ,
        -2.47236689, -2.41024818, -2.34812947, -2.28601076, -2.22389205,
        -2.16177334, -2.09965463, -2.03753592, -1.97541721, -1.9132985 ,
        -1.8511798 , -1.78906109, -1.72694238, -1.66482367, -1.60270496,
        -1.54058625, -1.47846754, -1.41634883, -1.35423012, -1.29211141,
        -1.2299927 , -1.167874  , -1.10575529, -1.04363658, -0.98151787,
        -0.91939916, -0.85728045, -0.79516174, -0.73304303, -0.67092432,
        -0.60880561, -0.5466869 , -0.4845682 , -0.42244949, -0.36033078,
        -0.29821207, -0.23609336, -0.17397465, -0.11185594, -0.04973723,
         0.01238148,  0.07450019,  0.1366189 ,  0.1987376 ,  0.26085631,
         0.32297502,  0.38509373,  0.44721244,  0.50933115,  0.57144986,
         0.63356857,  0.69568728,  0.75780599,  0.8199247 ,  0.8820434 ,
         0.94416211,  1.00628082,  1.06839953,  1.13051824,  1.19263695,
         1.25475566,  1.31687437,  1.37899308,  1.44111179,  1.5032305 ,
         1.5653492 ,  1.62746791,  1.68958662,  1.75170533,  1.81382404,
         1.87594275,  1.93806146,  2.00018017,  2.06229888,  2.12441759,
         2.1865363 ,  2.24865501,  2.31077371,  2.37289242,  2.43501113,
         2.49712984,  2.55924855,  2.62136726,  2.68348597,  2.74560468,
         2.80772339,  2.8698421 ,  2.93196081,  2.99407951,  3.05619822,
         3.11831693,  3.18043564,  3.24255435,  3.30467306,  3.36679177,
         3.42891048]),
 )


