Python数据分析:特征降维-主成分分析(PCA)
Python数据分析:特征降维-主成分分析(PCA)
principal components analysis(PCA)
- 用于减少数据集的维度,同时保持数据集中对方差贡献最大的特征
- 保留低阶主成分,忽略高阶成分,低阶成分往往能够保留数据最重要方面
方差与协方差:
-
用于衡量一系列点在它们的重心或均值附近的分散程度
-
方差:衡量数据点在一个维度的偏差
-
协方差:衡量一个维度是否会对另一个维度有所影响,从而查看两个维度之间是否有关系
-
方差与协方差之间的关系:某个维度与自身之间的协方差就是其方差
cov ( X , Y ) = ∑ i = 1 n ( X i − X ‾ ) ( Y i − Y ‾ ) n − 1 \operatorname{cov}(X, Y)=\frac{\sum_{i=1}^{n}\left(X_{i}-\overline{X}\right)\left(Y_{i}-\overline{Y}\right)}{n-1} cov(X,Y)=n−1∑i=1n(Xi−X)(Yi−Y)
协方差矩阵:
-
如果数据集是d维的,(x1,x2,…,xd),则可以计算出(x1,x2),(x2,x3),…,(xd-1,xd)之间的协方差。由于协方差的对称性,在加上各维度自身的协方差,可以构成协方差矩阵
C = ( cov ( x , x ) cov ( x , y ) cov ( x , z ) cov ( y , x ) cov ( y , y ) cov ( y , z ) cov ( z , x ) cov ( z , y ) cov ( z , z ) ) C=\left( \begin{array}{ccc}{\operatorname{cov}(x, x)} & {\operatorname{cov}(x, y)} & {\operatorname{cov}(x, z)} \\ {\operatorname{cov}(y, x)} & {\operatorname{cov}(y, y)} & {\operatorname{cov}(y, z)} \\ {\operatorname{cov}(z, x)} & {\operatorname{cov}(z, y)} & {\operatorname{cov}(z, z)}\end{array}\right) C=⎝⎛cov(x,x)cov(y,x)cov(z,x)cov(x,y)cov(y,y)cov(z,y)cov(x,z)cov(y,z)cov(z,z)⎠⎞ -
位于对角线上的是方差
-
协方差为正,代表两个变量变化趋势相同,反之亦然。
PCA:
- 通过线型变换将原数据映射到新的坐标系统中,使得映射后的第一个坐标上的方差最大(即第一主成分),第二个坐标上的方差第二大(第二主成分),以此类推。
PCA步骤:
-
数据集X∈Rm×n,其中每个样本x(i)=[x1(i),x2(i),…,xn(i)]
计算每个维度的均值
x ‾ = 1 m ∑ i = 1 m [ x l ( i ) , x 2 ( i ) , … , x n ( t ) ] ∈ R n \overline{\mathbf{x}}=\frac{1}{m} \sum_{i=1}^{m}\left[\mathbf{x}_{l}^{(i)}, \mathbf{x}_{2}^{(i)}, \ldots, \mathbf{x}_{n}^{(t)}\right] \in R^{n} x=m1i=1∑m[xl(i),x2(i),…,xn(t)]∈Rn
每个维度减去这个均值,得到一个矩阵,相当于将坐标系进行了平移
Y = [ x ( 1 ) − x ‾ x ( 2 ) − x ‾ … x ( m ) − x ‾ ] \mathbf{Y}=\left[ \begin{array}{c}{\mathbf{x}^{(1)}-\overline{\mathbf{x}}} \\ {\mathbf{x}^{(2)}-\overline{\mathbf{x}}} \\ {\ldots} \\ {\mathbf{x}^{(m)}-\overline{\mathbf{x}}}\end{array}\right] Y=⎣⎢⎢⎡x(1)−xx(2)−x…x(m)−x⎦⎥⎥⎤ -
构建协方差矩阵
Q = Y T Y = [ x ( 1 ) − x ‾ x ( 2 ) − x ‾ … x ( m ) − x ‾ ] [ x ( 1 ) − x ‾ x ( 2 ) − x ‾ … x ( m ) − x ‾ ] \mathbf{Q}=\mathbf{Y}^{T} \mathbf{Y}=\left[\mathbf{x}^{(1)}-\overline{\mathbf{x}} \quad \mathbf{x}^{(2)}-\overline{\mathbf{x}} \quad \ldots \quad \mathbf{x}^{(\mathrm{m})}-\overline{\mathbf{x}}\right] \left[ \begin{array}{c}{\mathbf{x}^{(1)}-\overline{\mathbf{x}}} \\ {\mathbf{x}^{(2)}-\overline{\mathbf{x}}} \\ {\ldots} \\ {\mathbf{x}^{(\mathrm{m})}-\overline{\mathbf{x}}}\end{array}\right] Q=YTY=[x(1)−xx(2)−x…x(m)−x]⎣⎢⎢⎡x(1)−xx(2)−x…x(m)−x⎦⎥⎥⎤ -
矩阵分解(如SVD),得到特征值及特征向量
-
将特征值从大到小排序,对应的特征向量就是第一主成分,第二主成分……
主成分个数的选取:
- 交叉验证
- 主成分的累计贡献率
PCA的应用:
- 特征提取
- 数据降维
加载所需模块和数据集:
from sklearn.datasets import load_digits
import numpy as np
from sklearn.decomposition import PCA
import matplotlib.pyplot as plt
%matplotlib inline

digits = load_digits()
X_digits, y_digits = digits.data, digits.target
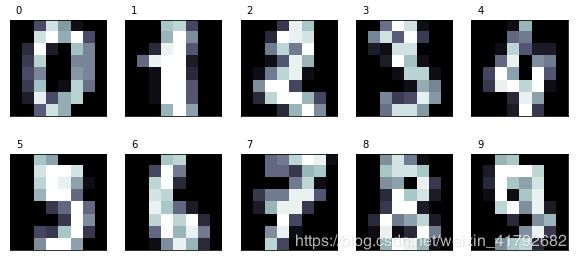
定义图像显示手写数字函数:
n_row, n_col = 2, 5

def plot_digits(images, y, max_n=10):
    """
        显示手写数字的图像
    """
    # 设置图像尺寸
    fig = plt.figure(figsize=(2. * n_col, 2.26 * n_row))
    i=0
    while i < max_n and i < images.shape[0]:
        p = fig.add_subplot(n_row, n_col, i + 1, xticks=[], yticks=[])
        p.imshow(images[i], cmap=plt.cm.bone, interpolation='nearest')
        # 添加标签
        p.text(0, -1, str(y[i]))
        i = i + 1

plot_digits(digits.images, digits.target, max_n=10)
定义主成分显示函数:
def plot_pca_scatter():
    """
        主成分显示
    """
    colors = ['black', 'blue', 'purple', 'yellow', 'white', 'red', 'lime', 'cyan', 'orange', 'gray']
    for i in range(len(colors)):
        # 只显示前两个主成分在二维坐标系中
        px = X_pca[:, 0][y_digits == i]
        py = X_pca[:, 1][y_digits == i]
        plt.scatter(px, py, c=colors[i])
    plt.legend(digits.target_names)
    plt.xlabel('First Principal Component')
    plt.ylabel('Second Principal Component')

n_components = 10 # 取前10个主成分
pca = PCA(n_components=n_components)
X_pca = pca.fit_transform(X_digits)
plot_pca_scatter()
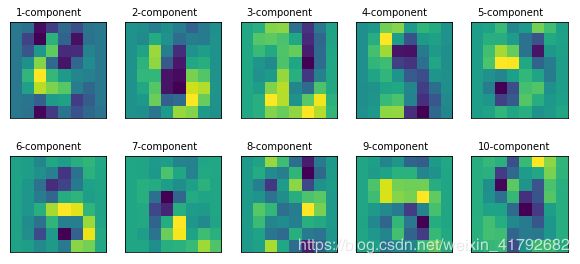
定义各主成分图像显示函数:
def print_pca_components(images, n_col, n_row):
    plt.figure(figsize=(2. * n_col, 2.26 * n_row))
    for i, comp in enumerate(images):
        plt.subplot(n_row, n_col, i + 1)
        plt.imshow(comp.reshape((8, 8)), interpolation='nearest')
        plt.text(0, -1, str(i + 1) + '-component')
        plt.xticks(())
        plt.yticks(())

print_pca_components(pca.components_[:n_components], n_col, n_row)


