library(ggplot2)
library(dplyr)
library(gganimate)
library(ggrepel)
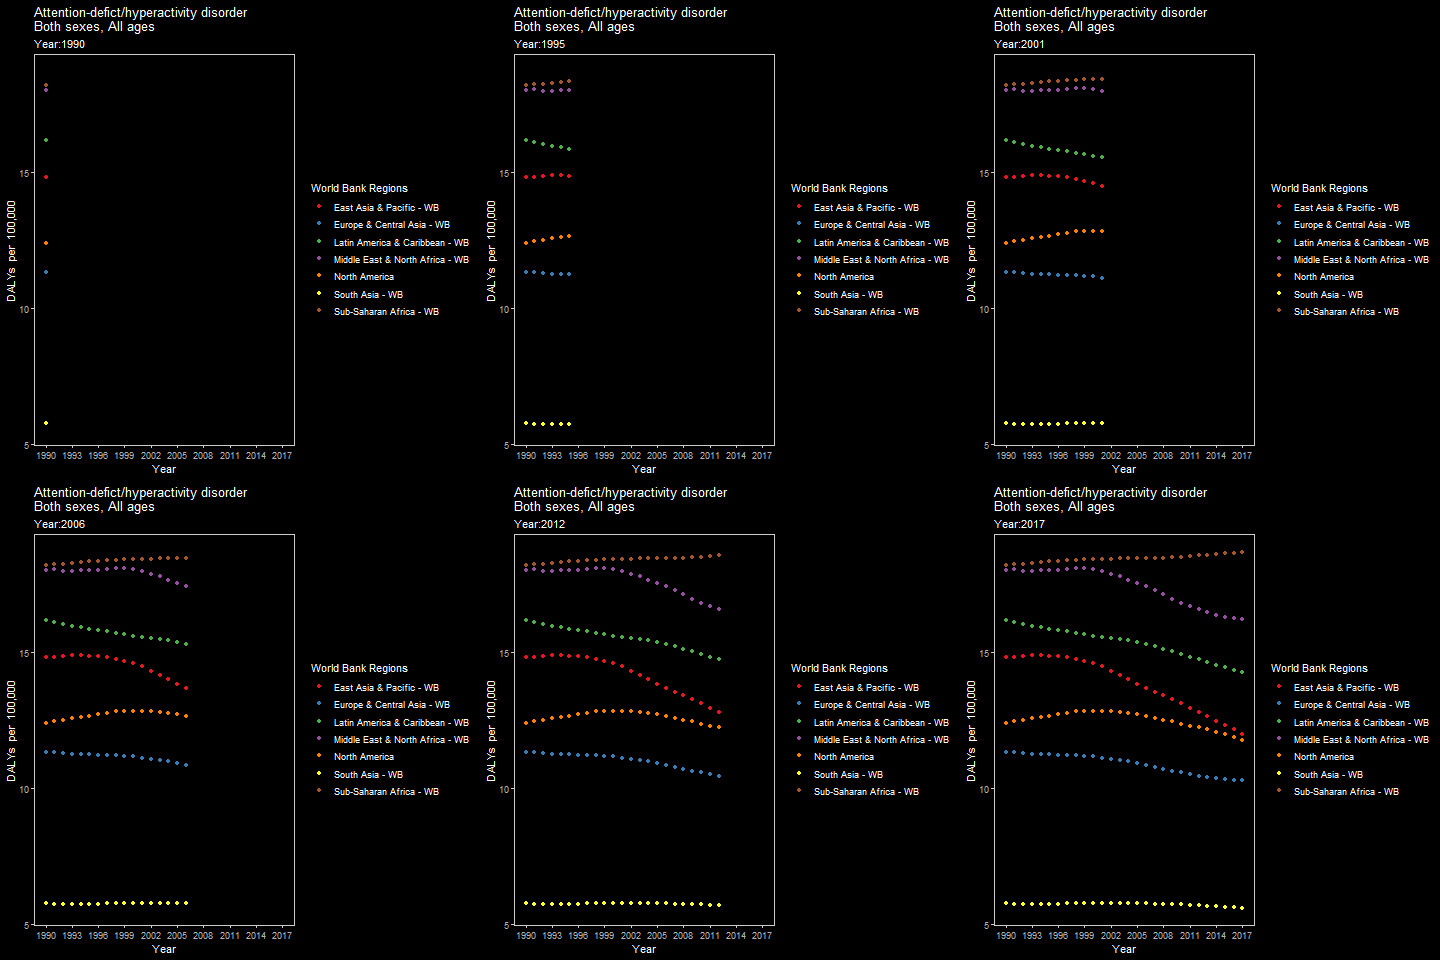
ADHD %>%
    ggplot(aes(x = Year, y = Value)) +
    geom_point(aes(color = Location)) +
    guides(size = F) +
    scale_x_continuous(breaks = seq(1990, 2017, 3)) +
    labs(title = 'Attention-defict/hyperactivity disorder\nBoth sexes, All ages',
         subtitle = 'Year:{current_frame}',
         color = 'World Bank Regions',
         y = "DALYs  per  100,000") +
    scale_color_brewer(palette = 'Set1') +
    transition_manual(Year, cumulative = T) +
    ggdark::dark_theme_bw() +
    theme(panel.grid = element_blank())

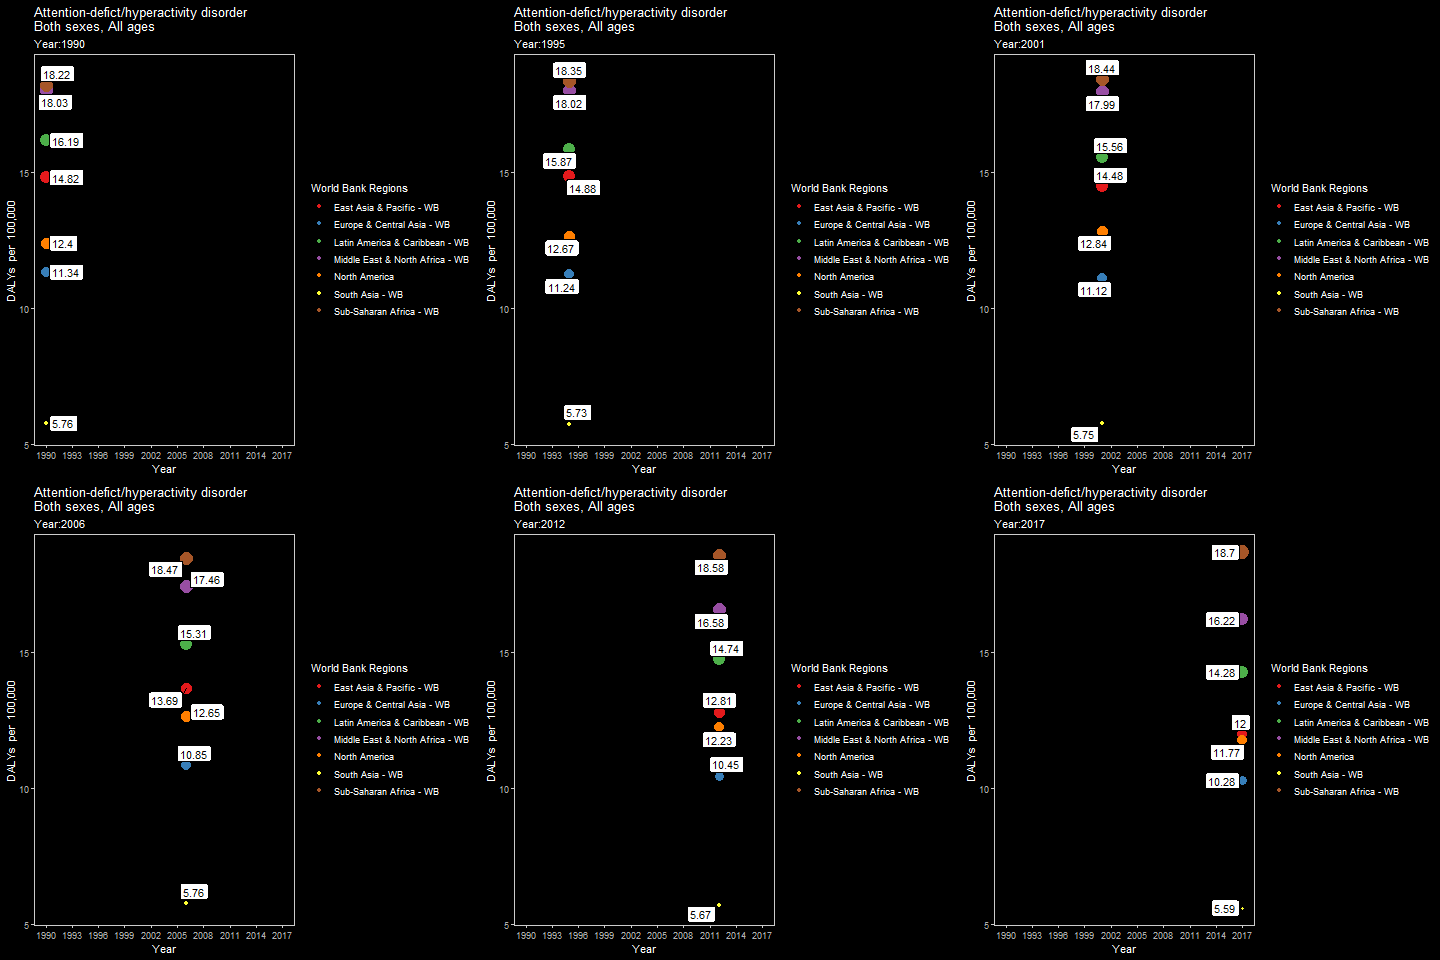
ADHD %>%
    ggplot(aes(x = Year, y = Value)) +
    geom_point(aes(color = Location, size = Value)) +
    geom_label_repel(aes(x = Year, y= Value, label = Value)) +
    guides(size = F) +
    scale_x_continuous(breaks = seq(1990, 2017, 3)) +
    labs(title = 'Attention-defict/hyperactivity disorder\nBoth sexes, All ages',
         subtitle = 'Year:{current_frame}',
         color = 'World Bank Regions',
         y = "DALYs  per  100,000") +
    scale_color_brewer(palette = 'Set1') +
    transition_manual(Year) +
    ggdark::dark_theme_bw() +
    theme(panel.grid = element_blank())

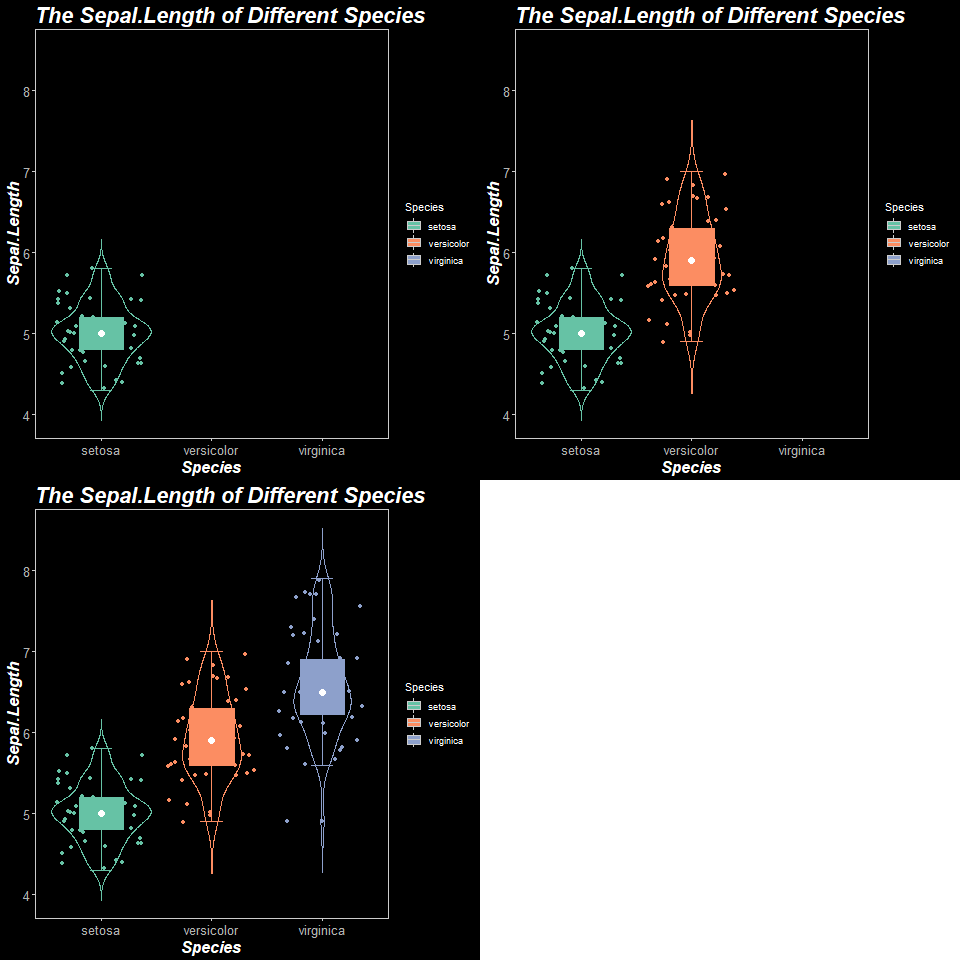
iris %>%
  ggplot(aes(Species, Sepal.Length, color = Species)) +
  geom_violin(trim = F) +
  geom_jitter() +
  stat_boxplot(geom = 'errorbar', width = 0.2) +
  geom_boxplot(aes(fill = Species), width = 0.4) +
  stat_summary(fun.y = median, geom = 'point', size = rel(3), color = 'white') +
  guides(color = F) +
  labs(title = 'The Sepal.Length of Different Species') +
  ggdark::dark_theme_bw() +
  theme(panel.grid = element_blank()) +
  scale_fill_brewer(palette = 'Set2') +
  scale_color_brewer(palette = 'Set2') +
  transition_manual(Species, cumulative = T) +
 theme(plot.title = element_text(face = 4, size = rel(2)),
          axis.title = element_text(face = 4, size = rel(1.5)),
          axis.text = element_text(size = rel(1.2)))

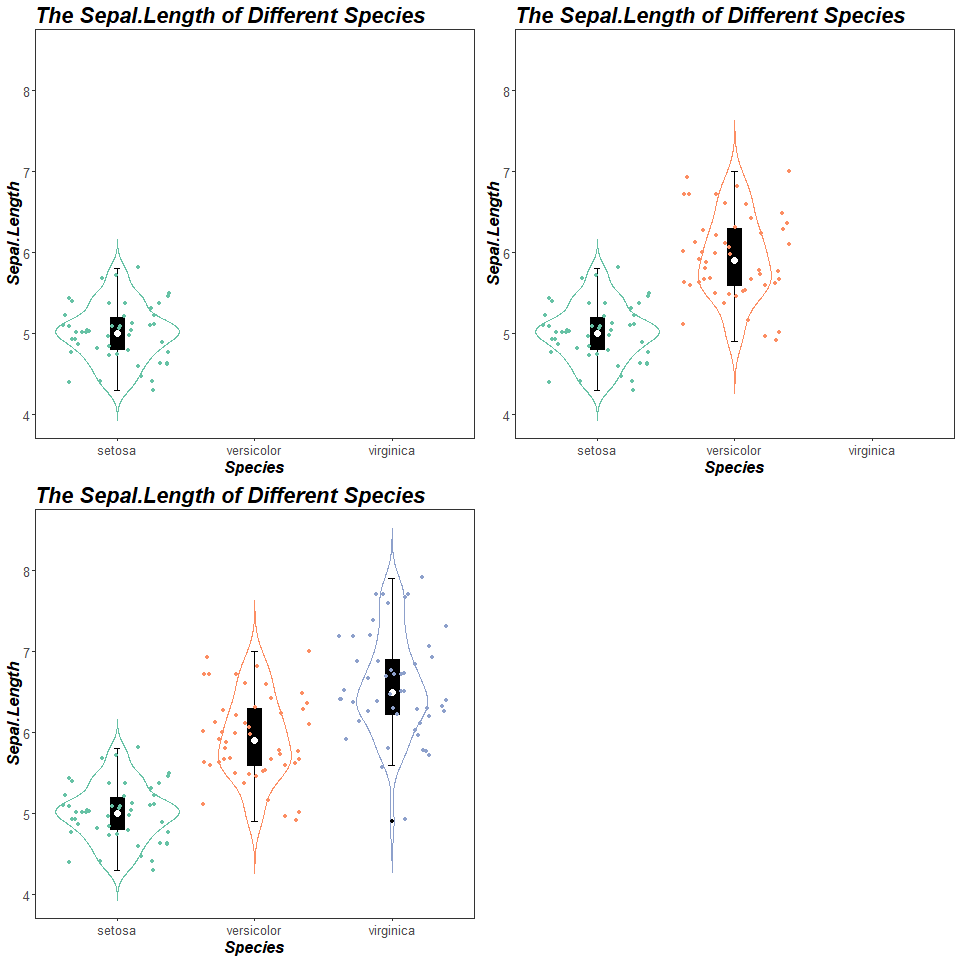
iris %>%
  ggplot(aes(Species, Sepal.Length, color = Species)) +
  geom_violin(fill = 'white', trim = F) +
  stat_boxplot(geom = 'errorbar', width = 0.05, color = 'black') +
  geom_boxplot(fill = 'black', color = 'black', width = 0.1) +
  stat_summary(fun.y = median, geom = 'point', size = rel(3), color = 'white') +
    geom_jitter() +
  guides(color = F) +
  labs(title = 'The Sepal.Length of Different Species') +
  theme_bw() +
  theme(panel.grid = element_blank()) +
  scale_fill_brewer(palette = 'Set2') +
  scale_color_brewer(palette = 'Set2') +
  transition_manual(Species, cumulative = T) +
  theme(plot.title = element_text(face = 4, size = rel(2)),
        axis.title = element_text(face = 4, size = rel(1.5)),
        axis.text = element_text(size = rel(1.2)))


