import numpy as np
import pandas as pd
import matplotlib as mpl
import matplotlib.pyplot as plt
import seaborn as sn
from pylab import *
mpl.rcParams['font.sans-serif']=['SimHei']
df=pd.read_csv('lianjia.csv')
print(df.head())
df['PerPrice']=df['Price']/df['Size']
columns=['Region','District','Garden','Layout','Floor','Year','Size','Elevator','Direction','Renovation','Price','PerPrice']
df=pd.DataFrame(df,columns=columns)
df.info()
df.loc[(df['Floor']>6),'Elevator']='有电梯'
df.loc[(df['Floor']<=6),'Elevator']='无电梯'
print(df.head(50))
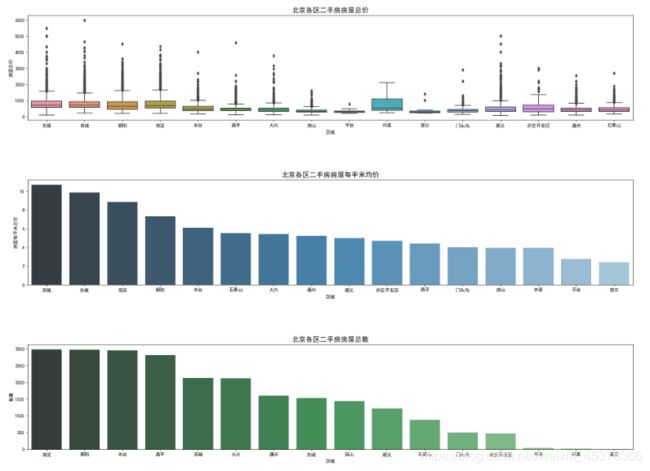
RegionDF1=df.groupby('Region')['PerPrice'].mean().sort_values(ascending=False).to_frame().reset_index()
RegionDF2=df.groupby('Region')['Price'].count().sort_values(ascending=False).to_frame().reset_index()
fig,[ax1,ax2,ax3]=plt.subplots(3,1,figsize=(20, 15))
sn.boxplot(x='Region',y='Price',data=df,ax=ax1)
ax1.set_title('北京各区二手房房屋总价',fontsize=15)
ax1.set_xlabel('区域')
ax1.set_ylabel('房屋总价')
sn.barplot(x='Region',y='PerPrice',palette='Blues_d',data=RegionDF1,ax=ax2)
ax2.set_title('北京各区二手房房屋每平米均价',fontsize=15)
ax2.set_xlabel('区域')
ax2.set_ylabel('房屋每平米总价')
sn.barplot(x='Region',y='Price',palette='Greens_d',data=RegionDF2,ax=ax3)
ax3.set_title('北京各区二手房房屋总数',fontsize=15)
ax3.set_xlabel('区域')
ax3.set_ylabel('数量')
fig.tight_layout(pad=5.0,h_pad=8.0)
plt.savefig("Region.png")
plt.show()
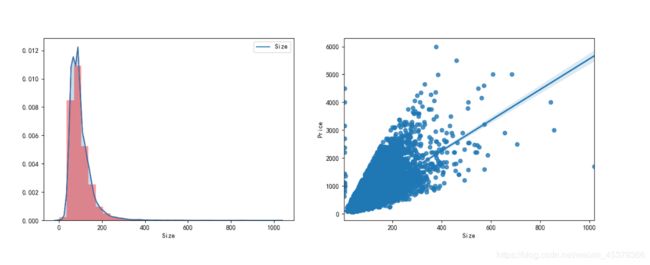
fig,[ax1,ax2]=plt.subplots(1,2,figsize=(15, 5))
sn.distplot(df['Size'],bins=30,ax=ax1,color='red')
sn.kdeplot(df['Size'], shade=True, ax=ax1)
sn.regplot(x='Size', y='Price', data=df, ax=ax2)
plt.savefig("Size.png")
plt.show()
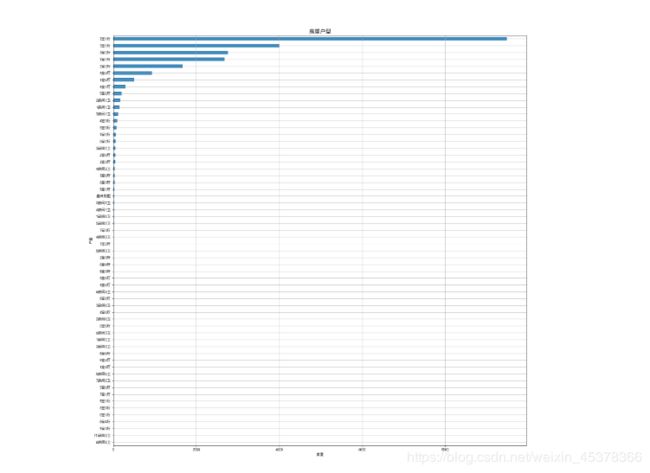
data_l=df['Layout'].value_counts().sort_values()
fig,ax1=plt.subplots(1,1,figsize=(20, 20))
data_l.plot.barh(grid=True,ax=ax1,alpha=0.9)
ax1.set_title('房屋户型',fontsize=15)
ax1.set_xlabel('数量')
ax1.set_ylabel('户型')
plt.savefig("Layout.png")
plt.show()
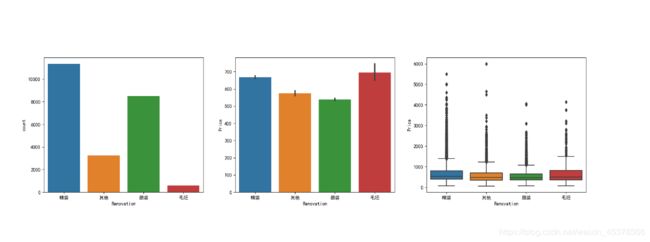
df['Renovation']=df.loc[(df['Renovation']!='南北'),'Renovation']
fig,[ax1,ax2,ax3]=plt.subplots(1,3,figsize=(20,5))
sn.countplot(df['Renovation'],ax=ax1)
sn.barplot(x='Renovation',y='Price',data=df,ax=ax2)
sn.boxplot(x='Renovation',y='Price',data=df,ax=ax3)
plt.savefig("Renovation.png")
plt.show()
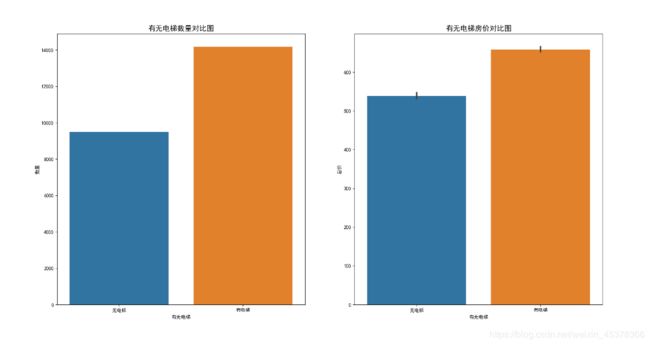
fig,[ax1,ax2] = plt.subplots(1,2,figsize=(20, 10))
sn.countplot(df['Elevator'],ax=ax1)
ax1.set_title('有无电梯数量对比图',fontsize=15)
ax1.set_xlabel('有无电梯')
ax1.set_ylabel('数量')
sn.barplot(x='Elevator', y='Price',data=df,ax=ax2)
ax2.set_title('有无电梯房价对比图',fontsize=15)
ax2.set_xlabel('有无电梯')
ax2.set_ylabel('总价')
plt.savefig("Elevator.png")
plt.show()
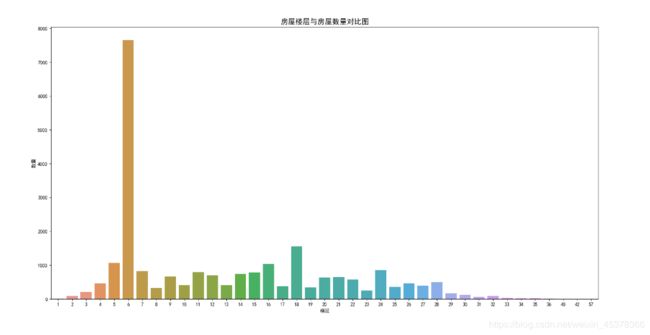
fig,ax=plt.subplots(figsize=(20, 10))
sn.countplot(x='Floor',data=df,ax=ax)
ax.set_title('房屋楼层与房屋数量对比图',fontsize=15)
ax.set_xlabel('楼层')
ax.set_ylabel('数量')
plt.savefig("Floor.png")
plt.show()
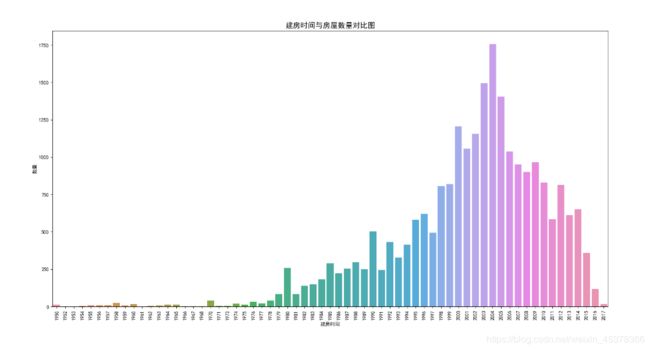
fig,ax=plt.subplots(figsize=(20, 10))
sn.countplot(x='Year',data=df,ax=ax)
ax.set_title('建房时间与房屋数量对比图',fontsize=15)
ax.set_xlabel('建房时间')
plt.xticks(rotation=90)
ax.set_ylabel('数量')
plt.savefig("Year.png")
plt.show()
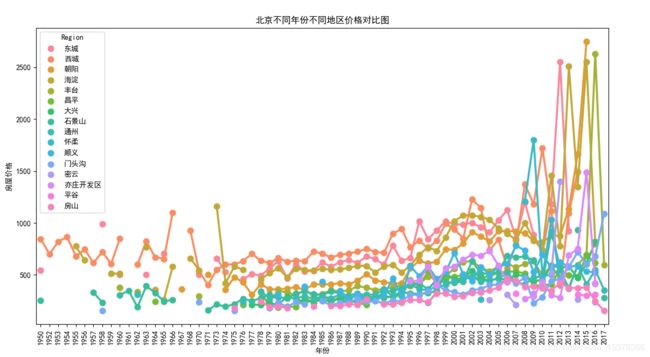
data_s=df[['Region','Year','Price']]
DataRegion=pd.DataFrame(data_s.groupby(['Year','Region'])['Price'].mean()).reset_index()
fig,ax=plt.subplots(figsize=(20,25))
region_order=['东城','西城','朝阳','海淀','丰台','昌平','大兴','石景山',
'通州','怀柔','顺义','门头沟','密云','亦庄开发区','平谷','房山']
sn.pointplot(x=DataRegion['Year'],y=DataRegion['Price'],hue=DataRegion['Region'],
hue_order=region_order,data=DataRegion)
ax.set(xlabel='年份', ylabel='房屋价格', title='北京不同年份不同地区价格对比图')
plt.xticks(rotation=90)
plt.savefig('Year_Region.png')
plt.show()
