Python数据分析(Matplotlib)之3D图形
能够使用Matplotlib构建的3D图形示例:
导入相关包:
from mpl_toolkits.mplot3d.axes3d import Axes3D生成数据,并进行相关绘图
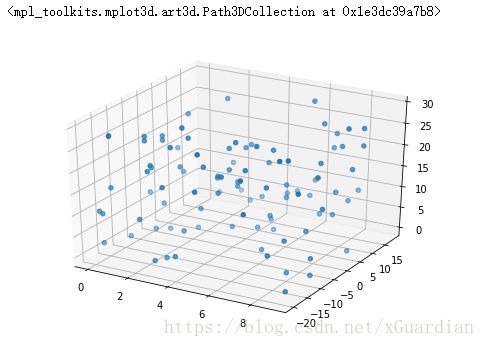
绘制3维的散点图,代码如下:
#绘制3维的散点图
x = np.random.randint(0,10,size=100)
y = np.random.randint(-20,20,size=100)
z = np.random.randint(0,30,size=100)

# 此处fig是二维
fig = plt.figure()

# 将二维转化为三维
axes3d = Axes3D(fig)

# axes3d.scatter3D(x,y,z)
# 效果相同
axes3d.scatter(x,y,z)
得到的效果如下图:
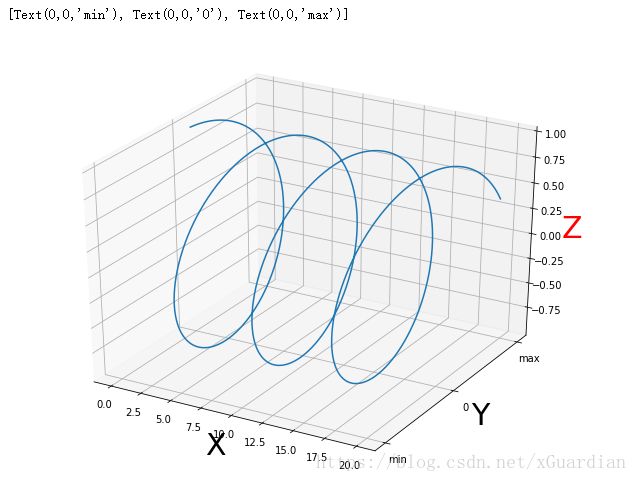
绘制三维的线形图,代码如下:
# 绘制三维的线性图
x = np.linspace(0,20,1000)

y = np.sin(x)
z = np.cos(x)

fig = plt.figure(figsize=(8,6))

axes3d = Axes3D(fig)

axes3d.plot(x,y,z)

plt.xlabel('X',size = 30)
plt.ylabel('Y',size = 30)
axes3d.set_zlabel('Z',color = 'r',size=30)

axes3d.set_yticks([-1,0,1])
axes3d.set_yticklabels(['min',0,'max'])
得到的线性图如下:
绘制三维柱状图,代码如下:
# 绘制三维柱状图
fig = plt.figure(figsize=(12,9))

axes3d = Axes3D(fig)


zs = [1,5,10,15,20]

for z in zs:
    x = np.arange(0,10)
    y = np.random.randint(0,30,size =10)
    axes3d.bar(x,y,zs = z,zdir = 'x',color=['r','green','yellow','purple'])
其中方法bar()中的相关参数示例如下:(此处根据tab键提示得出)
plt.bar()
# bar(x, height, *, align='center', **kwargs)
# bar(x, height, width, *, align='center', **kwargs)
# bar(x, height, width, bottom, *, align='center', **kwargs)
执行得到3维柱状图:
# 绘制三维曲面
fig = plt.figure()

axes3d = Axes3D(fig)

#!!面
x = np.linspace(-10,10,100)
y = np.linspace(-10,10,100)

X,Y = np.meshgrid(x,y)
Z = np.sqrt(X**2+Y**2)

axes3d.plot_surface(X,Y,Z)
得到3维曲面的效果图:
其中,我们需要关注的是numpy中的meshgrid函数,numpy官方文档meshgrid函数帮助文档:numpy官方文档meshgrid函数帮助文档
从坐标向量返回坐标矩阵。
在给定一维坐标数组x1,x2,...,xn的情况下,使ND坐标数组用于ND网格上的ND标量/矢量场的矢量化评估。
在版本1.9中更改:允许1-D和0-D情况。
| 参数: | x1,x2,...,xn:array_like
索引:{'xy','ij'},可选
稀疏:bool,可选
copy:bool,可选
|
|---|---|
| 返回: | X1,X2,...,XN:ndarray
|
若还是不能理解,可以多找找相关示例进行深度学习
绘制混合图形,本质也就是将2种图形的编码进行组合,放在同一三维模型中,相关代码如下:
# 绘制混合图形
# 绘制三维曲面
fig = plt.figure()

axes3d = Axes3D(fig)

#!!面
x = np.linspace(-10,10,100)
y = np.linspace(-10,10,100)

X,Y = np.meshgrid(x,y)
Z = np.sqrt(X**2+Y**2)

axes3d.plot_surface(X,Y,Z)

x = np.linspace(10,30)
y = np.sin(x)
z = np.cos(x)
axes3d.plot(x,y,z,color = 'r')
得到如下效果图:
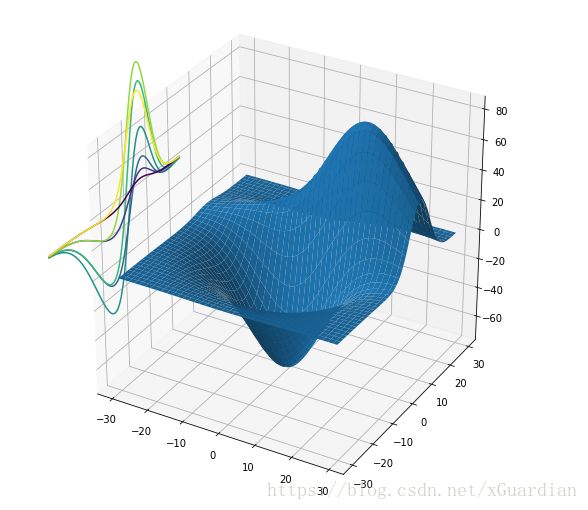
在完成基础3D图形的绘制后,再学习等高线,这一点我也不是特别熟悉,只能提供自己练习的代码:
# 绘制等高线
# 绘制面
from mpl_toolkits.mplot3d import axes3d

X,Y,Z = axes3d.get_test_data()

fig = plt.figure(figsize=(8,8))
axes3 = Axes3D(fig)

# 出现图形
axes3.plot_surface(X,Y,Z)

# 绘制等高线
axes3.contour(X,Y,Z,zdir = 'x',offset = -50)
最终显示的等高线如图:


