.Net 开源控件 NPlot使用小结
简介
NPlot是一款非常难得的.Net平台下的图表控件,能做各种曲线图,柱状图,饼图,散点图,股票图等,
而且它免费又开源,使用起来也非常符合程序员的习惯。授权方式为BSD许可证。
下载链接:http://nchc.dl.sourceforge.net/project/nplot/nplot/0.9.10.0/nplot-0.9.10.0.zip
一.转换及编译
这个版本是基于framework1.1的vs2005的工程,使用vs2008或者2010直接转换都提示失败。
在vs2010下的转换方式:
在编译,还有错误,提示重复的XX特性,在VS2010新建一个类库项目,
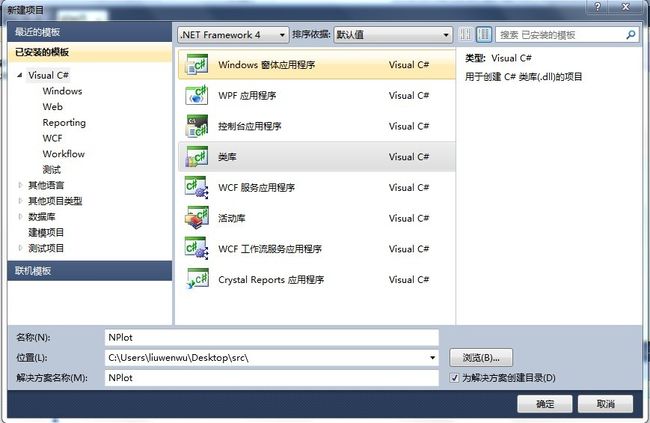
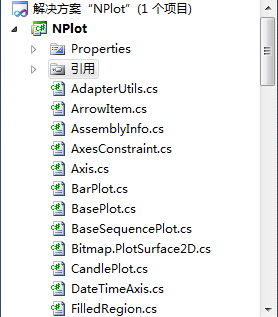
删除自动创建的cs文件Class1.cs
将源码src文件夹的所有文件复制到该项目的文件目录下,在项目中添加这些文件
试着编译一下,有错误
右击引用,选择添加引用
选择.NET选择夹,添加Systm.Drawing , System.Windws.Form , System.Web 及 System.Design。
进入项目文件夹,把AssemblyInfo.cs文件移动到Properties文件夹内,在项目内删除AssemblyInfo.cs
继续编译,还有错误,打开AssemblyInfo这个文件,注释掉最后一行,编译成功。
在bin/Release看到发行版本的NPlot.dl
二. 添加与使用
将NPlot添加到工具箱托盘中。
添加方式为:在工具箱上单击右键,选择“选择项”,会出现“选择工具箱项”对话框,在“.Net Frameworks组件”属性页,选择浏览,找到NPlot.dll添加到工具箱项。这时工具箱中会出现NPlot控件。在设计应用程序界面时,可以将其拖入应用程序界面,系统会在代码中自动创建一个PlotSurface2D对象。
手动引入空间:using NPlot。
NPlot的命名空间包括NPlot,NPlot.Bitmap,NPlot.Web,NPlot.Web.Design,NPlot.Windows等,其中最核心的,管理各种图表的类都属于NPlot命名空间,NPlot.Bitmap针对位图的管理,NPlot.Web,NPlot.Web.Design和NPlot.Windows则可视为NPlot图表在Web Form和Windows Form上的容器(PlotSurface
2D)。这些容器可以拖到Form上,也可以位于其他容器之中。
PlotSurface2D对象是NPlot图表的容器,所有的图表图形,坐标,标题(都继承IDrawable接口)等各种信息都可以被加入PlotSurface2D。PlotSurface2D拥有一个非常重要的方法:Add。各种图表图形,坐标,标题都可以通过Add加入PlotSurface2D对象。
示例代码:
using System;
using System.Collections.Generic;
using System.ComponentModel;
using System.Data;
using System.Drawing;
using System.Text;
using System.Windows.Forms;
using NPlot;


namespace WindowsForms
{
    public partial class Form1 : Form
    {
        public Form1()
        {
            InitializeComponent();
        }

        public void plotline()
        {
            // --- Plotting ---
            plot.Clear();   //对象名称为plot
            // --- Grid Code ---
            Grid mygrid = new Grid();
            mygrid.HorizontalGridType = Grid.GridType.None;
            mygrid.VerticalGridType = Grid.GridType.Fine;
            plot.Add(mygrid);
            plot.Title = "Test";
            StepPlot line = new StepPlot();
            line.Pen = new Pen(Color.Red, 1);
            line.OrdinateData = new int[] { 0, 1, 0, 1, 1, 0 };
            line.HideVerticalSegments = false;
            plot.Add(line);
            plot.Refresh();
            return;
        }

        //显示按钮
        private void button1_Click(object sender, EventArgs e)
        {
            plotline();
        }

       //清除按钮
        private void button2_Click(object sender, EventArgs e)
        {
            // --- Plotting ---
            plot.Clear();
            plot.Refresh();
        }

    }


}
三. 显示示例代码
////////对所绘的图进行打印与保存//////////
private void print()
{
    myPlot.Print(true);
}
private void save()
{
    saveFileDialog1.Filter = "位图 (*.bmp)|*.bmp|JPEG(*.jpg)|*.jpg;*.jpeg;*,jpe|Gif(*.gif)|*.gif|Tiff(*.tiff)|*.tiff|Png(*.png)|*.png|Exif(*.exif)|*.exif| 所有文件(*.*)|*.*";
    if (saveFileDialog1.ShowDialog() == DialogResult.OK)
    {
       try
        {
            int h = myPlot.Size.Height;
            int w = myPlot.Size.Width;
            Bitmap bm = new Bitmap(w, h);
            Bitmap bm1 = new Bitmap(w, h);
            Rectangle rt = new Rectangle(1, 1, w, h);
            saveFileDialog1.RestoreDirectory = true;
            saveFileDialog1.CreatePrompt = true;
            myPlot.DrawToBitmap(bm, rt);
            if (saveFileDialog1.FilterIndex == 1)
            {
                bm.Save(saveFileDialog1.FileName);
            }
            if (saveFileDialog1.FilterIndex == 2)
            {
                bm.Save(saveFileDialog1.FileName, ImageFormat.Jpeg);
            }
            if (saveFileDialog1.FilterIndex == 3)
            {
                bm.Save(saveFileDialog1.FileName, ImageFormat.Gif);
            }
            if (saveFileDialog1.FilterIndex == 4)
            {
                bm.Save(saveFileDialog1.FileName, ImageFormat.Tiff);
            }
            if (saveFileDialog1.FilterIndex == 5)
            {
                bm.Save(saveFileDialog1.FileName, ImageFormat.Png);
            }
            if (saveFileDialog1.FilterIndex == 6)
            {
                bm.Save(saveFileDialog1.FileName, ImageFormat.Exif);
            }
        }
        catch (Exception MyEx)
        {
            MessageBox.Show(MyEx.ToString(), "错误提示", MessageBoxButtons.OK, MessageBoxIcon.Warning);
        }
    }
}

///放大缩小
private void changeSize()
{
    this.myPlot.XAxis1.IncreaseRange(0.1);
    this.myPlot.YAxis1.IncreaseRange(0.1); //缩小
    this.myPlot.XAxis1.IncreaseRange(-0.1);
    this.myPlot.YAxis1.IncreaseRange(-0.1); //放大
    this.myPlot.Refresh();
}
/////////各种绘图//////////
private void plot()
{
    this.myPlot.Clear(
    ////////标签//////////
    string[] strLabel = new string[leng];
    for (int i = 0; i < leng; i++)
        strLabel[i] = Convert.ToString(p[i]);
    LabelPointPlot labp = new LabelPointPlot();
    labp.AbscissaData = X;
    labp.OrdinateData = p;
    labp.TextData = strLabel;
    labp.LabelTextPosition = LabelPointPlot.LabelPositions.Above;
    labp.Marker = new Marker(Marker.MarkerType.Square, 8);
    labp.Marker.Color = Color.Blue;
    myPlot.Add(labp);
    myPlot.Refresh();
    ////////网格//////////
    Grid mygrid = new Grid();
    mygrid.HorizontalGridType = Grid.GridType.Fine;
    mygrid.VerticalGridType = Grid.GridType.Fine;
    this.myPlot.Add(mygrid);
    ////////曲线,双坐标轴//////////
    ///////水平线//////////
    HorizontalLine line = new HorizontalLine(1.2);
    line.LengthScale = 0.89f;
    this.myPlot.Add(line, -10);
    ///////垂直线///////////
    VerticalLine line2 = new VerticalLine(1.2);
    line2.LengthScale = 0.89f;
    this.myPlot.Add(line2);
    ///////普通的线///////////
    LinePlot lp3 = new LinePlot();
    lp3.OrdinateData = yPW;
    lp3.AbscissaData = x;
    lp3.Pen = new Pen(Color.Orange);
    lp3.Pen.Width = 2;
    lp3.Label = " 价格";
    this.myPlot.Add(lp3);
    LinearAxis linx = (LinearAxis)myPlot.XAxis1;
    this.myPlot.XAxis1 = linx;
    LinearAxis liny = (LinearAxis)myPlot.YAxis1;
    liny.Label = "价格";
    liny.AxisColor = Color.Orange;
    liny.LabelColor = Color.Orange;
    liny.TickTextColor = Color.Orange;
    this.myPlot.YAxis1 = liny;
    LinePlot lp4 = new LinePlot();
    lp4.OrdinateData = yUw;
    lp4.AbscissaData = x;
    lp4.Pen = new Pen(Color.Green);
    lp4.Pen.Width = 2;
    lp4.Label = "销售量";
    this.myPlot.Add(lp4, PlotSurface2D.XAxisPosition.Top, PlotSurface2D.YAxisPosition.Right);
    LinearAxis liny2 = (LinearAxis)myPlot.YAxis2;
    liny2.WorldMax = 1.2;
    liny2.WorldMin = 0;
    liny2.Label = "销售量";
    liny2.AxisColor = Color.Green;
    liny2.LabelColor = Color.Green;
    liny2.TickTextColor = Color.Green;
    this.myPlot.YAxis2 = liny2;
    ///////图例//////////
    this.myPlot.Legend = new Legend();
    this.myPlot.Legend.AttachTo(PlotSurface2D.XAxisPosition.Top, PlotSurface2D.YAxisPosition.Right);
    this.myPlot.Legend.NumberItemsHorizontally = 2;
    this.myPlot.Legend.HorizontalEdgePlacement = Legend.Placement.Inside;
    this.myPlot.Legend.VerticalEdgePlacement = Legend.Placement.Inside;
    this.myPlot.Legend.YOffset = 5;
    this.myPlot.Legend.XOffset = -5;
    ///////窗体移动//////////
    this.myPlot.AddInteraction(new NPlot.Windows.PlotSurface2D.Interactions.HorizontalDrag());
    this.myPlot.AddInteraction(new NPlot.Windows.PlotSurface2D.Interactions.VerticalDrag());
    this.myPlot.AddInteraction(new NPlot.Windows.PlotSurface2D.Interactions.AxisDrag(true));
    //////累加的柱状图////////
    HistogramPlot hp3 = new HistogramPlot();
    hp3.AbscissaData = x;
    hp3.OrdinateData = yCC1;
    hp3.BaseWidth = 0.6f;
    hp3.RectangleBrush = RectangleBrushes.Vertical.FaintBlueFade;
    hp3.Filled = true;
    hp3.Label = "一月";
    HistogramPlot hp4 = new HistogramPlot();
    hp4.AbscissaData = x;
    hp4.OrdinateData = yCC2;
    hp4.Label = "二月";
    hp4.RectangleBrush = RectangleBrushes.Horizontal.FaintGreenFade;
    hp4.Filled = true;
    hp4.StackedTo(hp3);
    this.myPlot.Add(hp3);
    this.myPlot.Add(hp4);
    //////阶状图////////
    StepPlot sp1 = new StepPlot();
    sp1.OrdinateData = yCH1;
    sp1.AbscissaData = x;
    sp1.Label = "高度";
    sp1.Pen.Width = 2;
    sp1.Pen.Color = Color.Blue;
    this.myPlot.Add(sp1);
    /////点状图////////
    Marker m = new Marker(Marker.MarkerType.Cross1, 6, new Pen(Color.Blue, 2.0F));
    PointPlot pp = new PointPlot(m);
    pp.OrdinateData = a;
    pp.AbscissaData = new StartStep(-500.0, 10.0);
    pp.Label = "Random";
    this.myPlot.Add(pp);
    /////Image图////////
    double[,] map = new double[19, 19];
    for (int i = 0; i < 19; ++i)
    {
        for (int j = 0; j < 19; ++j)
        {
            map[i, j] = Convert.ToDouble(tokens[i * 19 + j], new
                System.Globalization.CultureInfo("en-US"));
        }
    }
    ImagePlot ip = new ImagePlot(map, -9.0f, 1.0f, -9.0f, 1.0f);
    ip.Gradient = new LinearGradient(Color.Gold, Color.Black);
    this.myPlot.SmoothingMode = System.Drawing.Drawing2D.SmoothingMode.None;
    this.myPlot.AddInteraction(new NPlot.Windows.PlotSurface2D.Interactions.RubberBandSelection());
    this.myPlot.Add(ip);
    ///////蜡烛图///////////
    int[] opens =  { 1, 2, 1, 2, 1, 3 };
    double[] closes = { 2, 2, 2, 1, 2, 1 };
    float[] lows =   { 0, 1, 1, 1, 0, 0 };
    System.Int64[] highs =  { 3, 2, 3, 3, 3, 4 };
    int[] times =  { 0, 1, 2, 3, 4, 5 };
    CandlePlot cp = new CandlePlot();
    cp.CloseData = closes;
    cp.OpenData = opens;
    cp.LowData = lows;
    cp.HighData = highs;
    cp.AbscissaData = times;
    this.myPlot.Add(cp);
    /////对数坐标轴////////

    // x axis
    LogAxis logax = new LogAxis(plotSurface.XAxis1);
    logax.WorldMin = xmin;
    logax.WorldMax = xmax;
    logax.AxisColor = Color.Red;
    logax.LabelColor = Color.Red;
    logax.TickTextColor = Color.Red;
    logax.LargeTickStep = 1.0f;
    logax.Label = "x";
    this.myPlot.XAxis1 = logax;
    // y axis
    LogAxis logay = new LogAxis(plotSurface.YAxis1);
    logay.WorldMin = ymin;
    logay.WorldMax = ymax;
    logay.AxisColor = Color.Red;
    logay.LabelColor = Color.Red;
    logay.TickTextColor = Color.Red;
    logay.LargeTickStep = 1.0f;
    logay.Label = "x^2";
    this.myPlot.YAxis1 = logay;
    /////字符坐标轴////////
    LabelAxis la1 = new LabelAxis(this.myPlot.XAxis1);
    string[] sX = new string [15];
    for (int i = 0; i < 15; i++)
    {
        la1.AddLabel(sX[i].ToString(), i);
    }
    la1.Label = "时间";
    la1.TickTextFont = new Font("Courier New", 10);
    la1.TicksBetweenText = true;
    this.myPlot.XAxis1 = la1;
    /////区域着色////////
    FilledRegion fr = new FilledRegion(new VerticalLine(1.2),new VerticalLine(2.4));
    //两条线之间的区域: FilledRegion fr = new FilledRegion(lp1, lp2);
    fr.Brush = Brushes.BlanchedAlmond;
    this.myPlot.Add(fr);
   //////画箭头//////////
    ArrowItem a = new ArrowItem(new PointD(2, 4),360-(30-90), "Arrow");
    a.HeadOffset = 5;
    a.ArrowColor = Color.Red;
    a.TextColor = Color.Purple;
    this.myPlot.Add(a);

    this.myPlot.Refresh();
}
//Sample code
//加入网格
Grid mygrid = new Grid();
myPlot.Add(mygrid);
myPlot.Title = "测试";
LinePlot lp = new LinePlot();
double[] a = new double[] { 1,2, 3, 4, 5, 6, 7, 8, 9, 10, 11, 12 };
string[] b = new string[] {"1", "2", "3", "4", "5","6", "7", "8", "9", "10","11", "12", };
double[] ab = new double[] { 0,0, 0, 0, 0, 0, 0, 0, 0, 0, 0, 0 };
ArrayList dates = newArrayList();
dates.Add(Convert.ToDateTime("2007-01-01"));
dates.Add(Convert.ToDateTime("2008-01-02 "));
dates.Add(Convert.ToDateTime("2008-01-03 "));
dates.Add(Convert.ToDateTime("2008-01-04 "));
dates.Add(Convert.ToDateTime("2008-01-05 "));
dates.Add(Convert.ToDateTime("2008-01-06"));
dates.Add(Convert.ToDateTime("2008-01-07 "));
dates.Add(Convert.ToDateTime("2008-01-08 "));
dates.Add(Convert.ToDateTime("2008-01-09 "));
dates.Add(Convert.ToDateTime("2008-01-10"));
dates.Add(Convert.ToDateTime("2008-01-11 "));
dates.Add(Convert.ToDateTime("2008-02-12 "));
lp.AbscissaData = dates;
//柱状
BarPlot storeGrowth = newBarPlot();
storeGrowth.AbscissaData =dates;
storeGrowth.OrdinateDataTop =a;
storeGrowth.OrdinateDataBottom= ab;
storeGrowth.FillBrush =NPlot.RectangleBrushes.Solid.Red;
//storeGrowth.BorderPen = newPen( Color.Black, 2.0f );
myPlot.Add(storeGrowth);
//标签
LabelPointPlot tp1 = newLabelPointPlot();
tp1.AbscissaData = dates;
tp1.OrdinateData = a;
tp1.TextData = b;
tp1.LabelTextPosition =LabelPointPlot.LabelPositions.Above;
tp1.Marker = newMarker(Marker.MarkerType.None, 10);
myPlot.Add(tp1);
//lp.
lp.DataSource = a;
lp.Pen = new Pen(Color.Blue,3.0f);
lp.Label = "GaussianFunction";
myPlot.Add(lp);
myPlot.XAxis1.Label = "时间";
myPlot.YAxis1.Label = "次数";
//myPlot.XAxis1.WorldLength = 60 * 60 * 24;
//设置网格距离
//myPlot.XAxis1.WorldMin +=myPlot.XAxis1.WorldLength/ 12;//WorldLength=n*24*60*60;
//myPlot.XAxis1.WorldMax -=myPlot.XAxis1.WorldLength / 2;
//myPlot.XAxis1.
//myPlot.XAxis1.WorldLength =10;
//myPlot.
//让日期斜45度。
myPlot.XAxis1.TicksLabelAngle =45;
//下面代码可让窗体移动begin;
myPlot.AddInteraction(newNPlot.Windows.PlotSurface2D.Interactions.HorizontalDrag());
//myPlot.AddInteraction(newNPlot.Windows.PlotSurface2D.Interactions.VerticalDrag());
myPlot.AddInteraction(newNPlot.Windows.PlotSurface2D.Interactions.AxisDrag(true));
myPlot.Refresh();