数据挖掘与数据分析(快速入门)
什么是数据挖掘与数据分析:
所谓数据分析,即对数据进行分析,然后提取出一些有价值的信息,比如统计出平均数,标准差等信息,数据分析的数据量有时可能不会太大,而数据挖掘,是指对大量数据进行分析与挖掘,得到一些未知的,有价值的信息等,比如从网站的用户或用户行为数据中挖掘出用户的潜在需求信息,从而对网站进行改善等。
数据分析与数据挖掘密不可分,数据挖掘是数据分析的提升。
数据分析与挖掘技术能做什么事情:
数据挖掘技术可以帮我们更好的发现事物之间的规律。所以我们可以利用数据挖掘技术实现规律探索,比如发现窃电用户,发掘用户潜在需求,实现信息个性化推送,发现疾病与症状甚至疾病与药物之间的规律…等。
数据挖掘的过程:
数据挖掘过程主要有:
1:定义目标
2:获取数据(常用的手段有通过爬虫采取或者下载一些统计网站发布的数据)
3:数据探索
4:数据处理(数据清洗**[去掉脏数据],数据集成[集中],数据变换
[规范化],数据规约[精简]**)
5:完结建模(分类,聚类,关联,预测)
6:模型评价与发布
数据分析与挖掘相关模块简介与安装:
本课概要:
- 相关模块简介
1:numpy可以高效的处理数据,提供数组支持,很多模块都依赖他,比如pandas,scip,matplotlib都依赖他,所以这个模块是个基础。
2:pandas我们课后需用的最多的一个模块,主要用于数据探索和数据分析。
3:matplotlib 作图模块,解决可视化问题。
4:scip主要进行数值计算,同时支持矩阵运算,并提供了很多高等数据处理功能,比如积分,傅里叶变换,微分方程求解等。
5:statsmodels 这个模块主要用于统计分析
6:Gensim 这个模块主要用于文本挖掘
7:sklearn,keras前者机器学习,后者深度学习
- 相关模块的安装与技巧
模块安装的顺序与方式建议如下:
1:numpy,kml(下载安装)
2:pandas
3:mataplotlib
4:scipy
5:statsmodels
6:Gensim
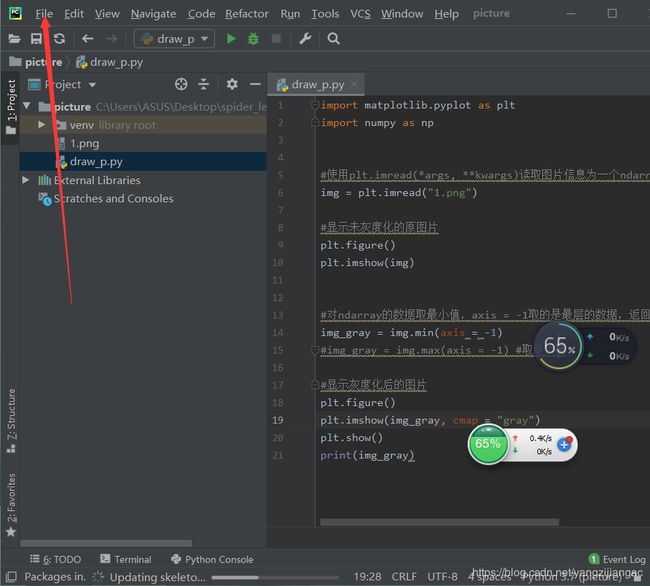
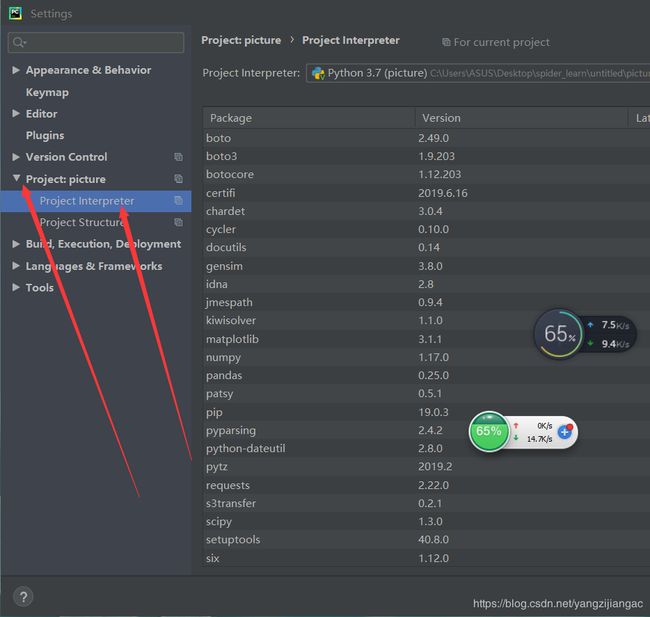
找到Setting

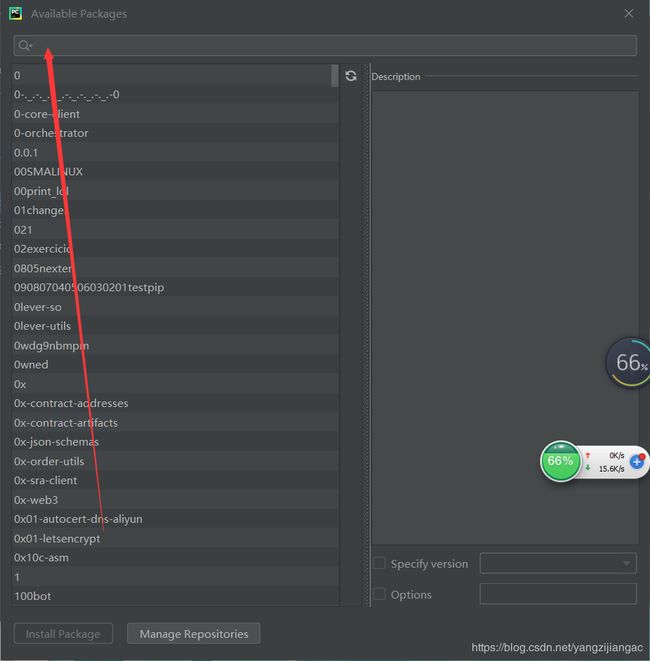
搜索要下载的包下载即可:
- 相关模块的基本使用
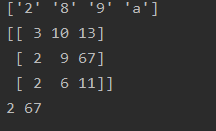
对numpy的数组应用
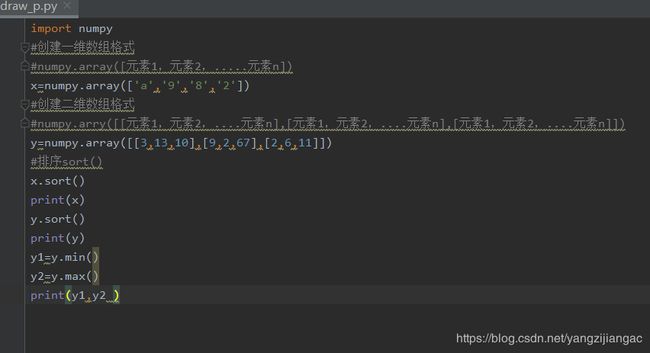
Result:
KNN算法实现
机器学习算法:KNN分类算法
-
KNN算法介绍:
KNN,K-NearestNeighbork 又称k最邻近所谓K最邻近,就是K个最邻近的意思,说的是每个样本都可以用它最接近的k个人邻居来代表,是一种分类算法,用于参考已知的数据,对未知实例的类别进行判断 -
算法流程
将每个样本视作一个点
1:载入数据,对数据进行必要的预处理
2:设置参数k,k最好选择技术,因为后续进行归类的策略是少数服从多数,设置k为奇数的话总会有结果。
3:计算待预测点与已知点之间的关系,这里的关系可以有多种方式来体现,常用如下:
1:欧式距离(应用较广,其他及其算法也有广泛的应用),其计算方法:

4:之前确定了参数k,计算带预测点与已知点之间的距离衡量,将计算结果进行从小到大排序,取取前k 个点
5:将待预测点归为一类为多数的哪一个类别,这便是对于未知点的预测结果
KNN算法实现:pythonimport numpy as np import operator import matplotlib.pyplot as plt class KNN(object): def __init__(self,k=3): self.k=k def fit(self,x,y): self.x=x self.y=y def _squqre_distance(self,v1,v2): return np.sum(np.square(v1-v2)) def vote(self,ys): ys_unique = np.unique(ys) vote_dict = {} for y in ys: if y not in vote_dict.keys(): vote_dict[y]=1 else: vote_dict[y]+=1 sorted_vote_dict = sorted(vote_dict.items(),key=operator.itemgetter(1),reverse=True) return sorted_vote_dict[0][0] def predict(self,x): y_pred=[] for i in range (len(x)): dist_arr = [self._squqre_distance(x[i],self.x[j])for j in range(len(self.x))] sorted_index = np.argsort(dist_arr) top_k_index =sorted_index[:self.k] y_pred.append(self.vote(ys=self.y[top_k_index])) return np.array(y_pred) def score(self,y_true=None,y_pred=None): if y_true is None or y_pred is None: y_pred = self.predict(self.x) y_true = self.y score = 0.0 for i in range(len(y_true)): if y_true[i]== y_pred[i]: score+=1 score/=len(y_true) return score
‘’‘data genernation’’’
np.random.seed(272)#利用随机数种子,每次生成的随机数相同
#print(np.random.randn(1,5))
data_size_1 = 300
#正态分布式画图
x1_1 = np.random.normal(loc=5.0,scale=1.0,size=data_size_1)
x2_1 = np.random.normal(loc=4.0,scale=1.0,size=data_size_1)
y1=[0 for _ in range(data_size_1)]

data_size_2=400
x1_2 = np.random.normal(loc=10.0,scale=2.0,size=data_size_2)
x2_2 = np.random.normal(loc=8.0,scale=2.0,size=data_size_2)
y2=[1 for _ in range(data_size_2)]

#列向量进行拼接
x1 = np.concatenate((x1_1, x1_2),axis=0)
x2=np.concatenate((x2_1,x2_2),axis=0)
x = np.hstack((x1.reshape(-1,1),x2.reshape(-1,1)))
y=np.concatenate((y1,y2),axis=0)

data_size_all=data_size_1+data_size_2
shuffled_index= np.random.permutation(data_size_all)
x = x[shuffled_index]
y = y[shuffled_index]

split_index =int(data_size_all*0.7)
x_train = x[:split_index]
y_train = y[:split_index]
x_test = x[split_index:]
y_test = y[split_index:]
#visual data
plt.scatter(x_train[:,0],x_train[:,1],c=y_train,marker='.')
plt.show()
plt.scatter(x_test[:,0],x_test[:,1],c=y_test,marker='.')
plt.show()
#data preprocessing
x_train = (x_train-np.min(x_train,axis=0))/(np.max(x_train,axis=0)-np.min(x_train,axis=0))
x_test = (x_test-np.min(x_test,axis=0))/(np.max(x_test,axis=0)-np.min(x_test,axis=0))

clf = KNN(k=3)
clf.fit(x_train,y_train)
score_train=clf.score()
print('train accuarcy:{:.3}'.format(score_train))
y_test_pred =clf.predict(x_test)
print('train accuarcy:{:.3}'.format(clf.score(y_test,y_test_pred)))