python scipy教程
Scipy
Scipy是一个高级的科学计算库,建立在低一级的numpy的多维数组之上。Scipy有很多子模块可以完成不同的操作,如傅里叶变换、插值运算、优化算法和数学统计等。Scipy的常用的子模块如下:
scipy.cluster	        向量量化
scipy.constants	        数学常量
scipy.fftpack	        快速傅里叶变换
scipy.integrate	        积分
scipy.interpolate	    插值
scipy.io	            数据输入输出
scipy.linalg	        线性代数
scipy.ndimage	        N维图像
scipy.odr	            正交距离回归
scipy.optimize	        优化算法
scipy.signal	        信号处理
scipy.sparse	        稀疏矩阵
scipy.spatial	        空间数据结构和算法
scipy.special	        特殊数学函数
scipy.stats	            统计函数
文件输入和输出
该模块可以加载和保存matlab文件。
>>> from scipy import io as spio
>>> a = np.ones((3,3))
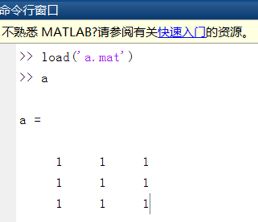
>>> spio.savemat('a.mat',{'a':a})
>>> data = spio.loadmat('a.mat',struct_as_record = True)
从MATLAB读取a.mat:

Figure 1
积分
>>> from scipy.integrate import quad, dblquad
>>> def f(x):
     	return x
>>> x_lower = 0
>>> x_upper = 10
>>> quad(f, x_lower, x_upper)
(50.0, 5.551115123125783e-13)
>>> def f1(x,n):
    	return x**n
有参数的函数的积分:
>>> quad(f1, x_lower, x_upper, args = (2,))
(333.33333333333326, 3.700743415417188e-12)
二重积分:
>>> dblquad(f2, x_lower, x_upper, y_lower, y_upper)
>>> dblquad(f2, x_lower, x_upper, lambda x:y_lower, lambda x:y_upper)
(2000.0, 2.220446049250313e-11)
傅里叶变换
from scipy.fftpack import *
N = 500
f0 = 10
fs = 500
phy = [2*math.pi*f0*t/fs for t in range(N)]
sig = [math.cos(i) for i in phy]
sig_fft = fft(sig)

线性代数
- 解线性方程组
>>> from scipy.linalg import *
>>> A = np.array([[1,4,5], [6,4,2], [8,3,5]])
>>> b = np.array([4,6,8])
>>> x = solve(A,b)
>>> x
array([0.625, 0.375, 0.375])
- 计算特征值和特征向量
>>> evals = eigvals(A)
>>> evals
array([12.55508516+0.j, -4.52605043+0.j,  1.97096527+0.j])
>>> evals, evecs = eig(A)
>>> evecs
array([[ 0.48407924,  0.75702936,  0.05203827],
       [ 0.50633806, -0.41420767, -0.77485696],
       [ 0.71364491, -0.50531035,  0.62999104]])
特殊函数
在scipy.special中,有一些常用的函数,如
- 贝塞尔函数,比如scipy.special.jn() (第n个整型顺序的贝塞尔函数)
- 椭圆函数 (scipy.special.ellipj() Jacobian椭圆函数, …)
- Gamma 函数: scipy.special.gamma(), 也要注意 scipy.special.gammaln() 将给出更高准确数值的 Gamma的log。
- Erf, 高斯曲线的面积:scipy.special.erf()
最优化问题
最优化问题就是我们常用的寻找最大最小值的问题,是数学的一个重要领域。
from scipy import optimize
def f(x):
    return 2*x**3 + (x-4)**2 + x**4
fig,ax = plt.subplots()
x = np.linspace(-3,3,200)
ax.plot(x,f(x))
y_min = optimize.fmin_bfgs(f, -2)
array([0.82600516])
概率统计
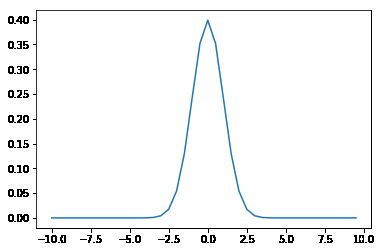
- 求正态分布的概率密度函数(pdf)
import numpy as np
from scipy import stats
import matplotlib.pyplot as plt
bins = np.arange(-10,10,0.5)
b = stats.norm.pdf(bins)
plt.figure()
plt.plot(bins, b)

Figure 2
- 概率分布拟合,估计潜在分布的参数
arr = np.random.normal(size=1000)
loc, std = stats.norm.fit(arr)
print('loc=%f, std=%f' % (loc, std))
>>> loc=-0.022044, std=1.003499
- 统计检验
统计检验是一个决策指示器。例如,如果我们有两组观察值,我们假设他们来自于高斯过程,我们可以用T检验来决定这两组观察值是不是显著不同:
a = np.random.normal(0, 1, size=100)
b = np.random.normal(1, 1, size=10)
stats.ttest_ind(a, b)
>>> (-2.8365663431591557, 0.0054465620169369703)
生成的结果由以下内容组成:
- T 统计值:一个值,符号与两个随机过程的差异成比例,大小与差异的程度有关。
- p 值:两个过程相同的概率。如果它接近1,那么这两个过程几乎肯定是相同的。越接近于0,越可能这两个过程有不同的平均数。
插值
import numpy as np
from scipy.interpolate import interp1d

x = np.linspace(0, 10*np.pi, 20)
y = np.cos(x)

# 分别用linear和quadratic插值
fl = interp1d(x, y, kind='linear')
fq = interp1d(x, y, kind='quadratic')

xint = np.linspace(x.min(), x.max(), 1000)
yintl = fl(xint)
yintq = fq(xint)

plt.figure(figsize = (7,5))
plt.plot(yintl, color='r', label='linear')
plt.plot(yintq, color='g', label='quadratic')
plt.legend(loc=1)
plt.grid(True)
plt.axis('tight')

Figure 3