sklearn cookbook 总结
Sklearn cookbook总结
1 数据预处理
1.1 获取数据
sklearn自带一些数据集,可以通过datasets模块的load_*方法加载,还有一些数据集比较大,可以通过fetch_*的方式下载。下面的代码示例了加载boston的房价数据和下载california的房价数据的方法。
from sklearn import datasets

boston = datasets.load_boston()
print(boston.DESCR)

california = datasets.fetch_california_housing('./temp')
# print(california.DESCR)
Boston House Prices dataset
===========================

Notes
------
Data Set Characteristics:

    :Number of Instances: 506

    :Number of Attributes: 13 numeric/categorical predictive

    :Median Value (attribute 14) is usually the target

    :Attribute Information (in order):
        - CRIM     per capita crime rate by town
        - ZN       proportion of residential land zoned for lots over 25,000 sq.ft.
        - INDUS    proportion of non-retail business acres per town
        - CHAS     Charles River dummy variable (= 1 if tract bounds river; 0 otherwise)
        - NOX      nitric oxides concentration (parts per 10 million)
        - RM       average number of rooms per dwelling
        - AGE      proportion of owner-occupied units built prior to 1940
        - DIS      weighted distances to five Boston employment centres
        - RAD      index of accessibility to radial highways
        - TAX      full-value property-tax rate per $10,000
        - PTRATIO  pupil-teacher ratio by town
        - B        1000(Bk - 0.63)^2 where Bk is the proportion of blacks by town
        - LSTAT    % lower status of the population
        - MEDV     Median value of owner-occupied homes in $1000's

    :Missing Attribute Values: None

    :Creator: Harrison, D. and Rubinfeld, D.L.

This is a copy of UCI ML housing dataset.
http://archive.ics.uci.edu/ml/datasets/Housing


This dataset was taken from the StatLib library which is maintained at Carnegie Mellon University.

The Boston house-price data of Harrison, D. and Rubinfeld, D.L. 'Hedonic
prices and the demand for clean air', J. Environ. Economics & Management,
vol.5, 81-102, 1978.   Used in Belsley, Kuh & Welsch, 'Regression diagnostics
...', Wiley, 1980.   N.B. Various transformations are used in the table on
pages 244-261 of the latter.

The Boston house-price data has been used in many machine learning papers that address regression
problems.

**References**

   - Belsley, Kuh & Welsch, 'Regression diagnostics: Identifying Influential Data and Sources of Collinearity', Wiley, 1980. 244-261.
   - Quinlan,R. (1993). Combining Instance-Based and Model-Based Learning. In Proceedings on the Tenth International Conference of Machine Learning, 236-243, University of Massachusetts, Amherst. Morgan Kaufmann.
   - many more! (see http://archive.ics.uci.edu/ml/datasets/Housing)
1.2 数据处理
sklearn的preprocess模块提供了若干预处理数据的方法。其功能如下:
| 类或方法 | 作用 |
|---|---|
| StandardScaler | 数据减去均值后除以方差 |
| MinMaxScaler | 减去最小值除以最大最小值的差 |
| normalize | 将数据除以所有点的平方和 |
| binary | 由设置的阀值s进行二值化,x>s?1:0 |
其使用示例如下,由于是二维数组,计算在列上进行,即axis为0:
import numpy as np
from sklearn import preprocessing

a = np.array([[4., 2.], [2., 4.], [2, -2]], dtype=np.float)

print(a)

scaler = preprocessing.StandardScaler()
r = scaler.fit_transform(a)
print(r)

scaler = preprocessing.MinMaxScaler()
r = scaler.fit_transform(a)
print(r)

r = preprocessing.normalize(a)
print(r)

binary = preprocessing.Binarizer(3.5)
r = binary.fit_transform(a)
print(r)
[[ 4.  2.]
 [ 2.  4.]
 [ 2. -2.]]
[[ 1.41421356  0.26726124]
 [-0.70710678  1.06904497]
 [-0.70710678 -1.33630621]]
[[1.         0.66666667]
 [0.         1.        ]
 [0.         0.        ]]
[[ 0.89442719  0.4472136 ]
 [ 0.4472136   0.89442719]
 [ 0.70710678 -0.70710678]]
[[1. 0.]
 [0. 1.]
 [0. 0.]]
###1.3 分类编码
对于类别型的数据,需要将其数值化,以支持向量运算。
对于数值型的,可以使用preprocessing包的OneHotEncoder;对于字符串型的需要借助feature_extraction模块来进行。
from sklearn import preprocessing
from sklearn.feature_extraction import DictVectorizer


labels = [[1], [2], [3], [2]]

onehot = preprocessing.OneHotEncoder()
y = onehot.fit_transform(labels)

print(y.toarray())


labels = [{'kind':'apple'}, {'kind':'orange'}]
dv = DictVectorizer()
y = dv.fit_transform(labels)
print(y.toarray())


labels = [1,2,3,3,2,1]
lb = preprocessing.LabelBinarizer()
vec = lb.fit_transform(labels)
print(vec)
[[1. 0. 0.]
 [0. 1. 0.]
 [0. 0. 1.]
 [0. 1. 0.]]
[[1. 0.]
 [0. 1.]]
[[1 0 0]
 [0 1 0]
 [0 0 1]
 [0 0 1]
 [0 1 0]
 [1 0 0]]
1.4 缺失值处理
缺失值可以表示为nan,但在计算中无法使用,因此根据需要可以填充为合适的值。sklearn和pandas都能处理缺失值。
import pandas as pd
from sklearn import preprocessing


data = np.array([[1, 2], [np.nan, 4]])
print('origin:\n', data)

imputer = preprocessing.Imputer(strategy='mean')
r = imputer.fit_transform(data)
print('sklean:\n', r)


data_df = pd.DataFrame(data)
df = data_df.fillna(data_df.mean())
print('pandas\n',df)
origin:
 [[ 1.  2.]
 [nan  4.]]
sklean:
 [[1. 2.]
 [1. 4.]]
pandas
      0    1
0  1.0  2.0
1  1.0  4.0
1.5 去除无用的维度
PCA是sklearn的一个分解模块,可以借助它来完成数据降维。
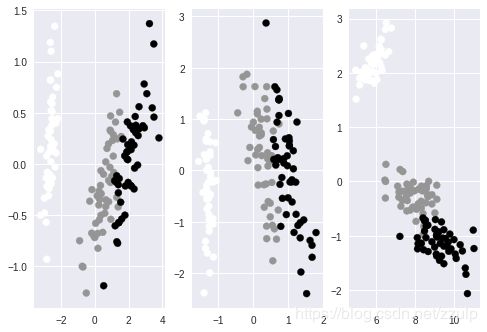
下面的代码对iris的特征进行PCA降维,通过对各维度的贡献分析,96%的变量可以由前两个主成分表示。因此可以把数据降低到前两维上,通过对PCA的参数n_components指定维度或比例,可以将数据进行降维。在只有两维的数据上通过plot作图以验证数据的可分性。
降维的另一个方法是使用FactorAnalysis类,使用上和PCA类似。其支持的核函数有liner, poly, rbf, sigmoid, cosine。
最后,利用矩阵的SVD也可以实现数据降维。各种降维方法的示例代码及效果如下:
import matplotlib.pyplot as plt

from sklearn import datasets
from sklearn.decomposition import PCA, FactorAnalysis
from sklearn.decomposition import TruncatedSVD


iris = datasets.load_iris()

pca = PCA()
dt = pca.fit_transform(iris.data)
print(pca.explained_variance_ratio_)

'''
array([  8.05814643e-01,   1.63050854e-01,   2.13486883e-02,......)
'''

fig, axes = plt.subplots(1,3)

pca = decomposition.PCA(n_components = 2)
dt = pca.fit_transform(iris.data)
axes[0].scatter(dt[:,0], dt[:,1], c=iris.target)


fa = FactorAnalysis(n_components=2)
dt = fa.fit_transform(iris.data)
axes[1].scatter(dt[:,0], dt[:,1], c=iris.target)


svd = TruncatedSVD()
dt = svd.fit_transform(iris.data)
axes[2].scatter(dt[:,0], dt[:,1], c=iris.target)
[0.92461621 0.05301557 0.01718514 0.00518309]
1.6 使用pipeline连接多个变换
对于多步处理,pipeline提供了一种便捷的组织代码的方式。如下示例:
from sklearn import pipeline, preprocessing, decomposition, datasets

iris = datasets.load_iris()

imputer = preprocessing.Imputer()
pca = decomposition.PCA(n_components=2)
line = [('imputer', imputer), ('pca', pca)]

pipe = pipeline.Pipeline(line)
dt = pipe.fit_transform(iris.data)
print dt.shape #(150,2)
1.7 利用高斯随机过程处理回归
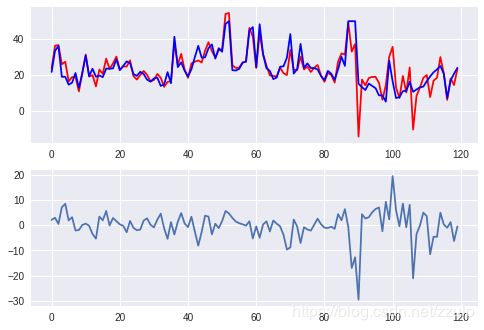
如果假设变量的分布和自变量符合高斯分布或正态分布,则可以使用高斯过程来进行回归分析。
from sklearn import datasets
from sklearn.gaussian_process import GaussianProcess

boston = datasets.load_boston()

sel = np.random.choice([True, False], len(boston.data), p=[0.75, 0.25])
gp = GaussianProcess()
gp.fit(boston.data[sel], boston.target[sel])

pred = gp.predict(boston.data[~sel])
diff = pred - boston.target[~sel]
xtick = range(len(pred))

fig, axes = plt.subplots(2,1)

axes[0].plot(xtick, pred, c='red',label='predict')
axes[0].plot(xtick, boston.target[~sel], c='blue', label='real')

axes[1].plot(xtick, diff)

plt.show()
/usr/local/lib/python3.6/dist-packages/sklearn/utils/deprecation.py:58: DeprecationWarning: Class GaussianProcess is deprecated; GaussianProcess was deprecated in version 0.18 and will be removed in 0.20. Use the GaussianProcessRegressor instead.
warnings.warn(msg, category=DeprecationWarning)
/usr/local/lib/python3.6/dist-packages/sklearn/utils/deprecation.py:77: DeprecationWarning: Function l1_cross_distances is deprecated; l1_cross_distances was deprecated in version 0.18 and will be removed in 0.20.
warnings.warn(msg, category=DeprecationWarning)
/usr/local/lib/python3.6/dist-packages/sklearn/utils/deprecation.py:77: DeprecationWarning: Function constant is deprecated; The function constant of regression_models is deprecated in version 0.19.1 and will be removed in 0.22.
warnings.warn(msg, category=DeprecationWarning)
/usr/local/lib/python3.6/dist-packages/sklearn/utils/deprecation.py:77: DeprecationWarning: Function squared_exponential is deprecated; The function squared_exponential of correlation_models is deprecated in version 0.19.1 and will be removed in 0.22.
warnings.warn(msg, category=DeprecationWarning)
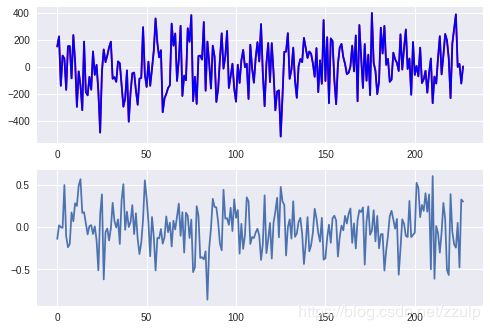
1.8 SGD处理回归
from sklearn import datasets
from sklearn.linear_model import SGDRegressor

X, y = datasets.make_regression(1000)
sel = np.random.choice([True, False], len(X), p=[0.75, 0.25])

sgd = SGDRegressor(max_iter=10, tol=0.1)
sgd.fit(X[sel], y[sel])

pred = sgd.predict(X[~sel])
diff = pred - y[~sel]

xtick = range(len(pred))

fig, axes = plt.subplots(2,1)

axes[0].plot(xtick, pred, c='red',label='predict')
axes[0].plot(xtick, y[~sel], c='blue', label='real')

axes[1].plot(xtick, diff)

plt.show()
2 线性模型
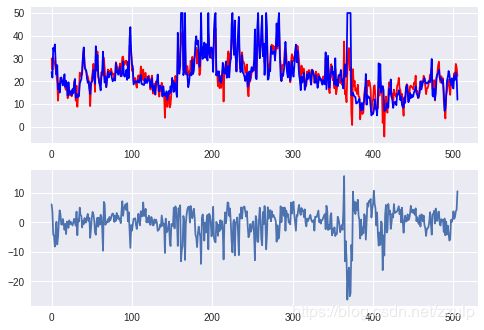
2.1 线性回归模型
from sklearn import datasets
from sklearn import linear_model

boston = datasets.load_boston()
model = linear_model.LinearRegression()

model.fit(boston.data, boston.target)
print(model.coef_)

pred = model.predict(boston.data)
diff = pred - boston.target
xtick = range(len(pred))

fig, axes = plt.subplots(2,1)

axes[0].plot(xtick, pred, c='red',label='predict')
axes[0].plot(xtick, boston.target, c='blue', label='real')

axes[1].plot(xtick, diff)

plt.show()
[-1.07170557e-01  4.63952195e-02  2.08602395e-02  2.68856140e+00
 -1.77957587e+01  3.80475246e+00  7.51061703e-04 -1.47575880e+00
  3.05655038e-01 -1.23293463e-02 -9.53463555e-01  9.39251272e-03
 -5.25466633e-01]
2.2 岭回归
岭回归在处理非满秩的矩阵时比较有用。 它可以去除不相关的系数。
为了找到合适的参数,可以使用交叉验证的方法。
from sklearn.datasets import make_regression
from sklearn.linear_model import LinearRegression, Ridge, RidgeCV
X, y = make_regression(n_samples=100, n_features=3, effective_rank=2, noise=5)


lr = LinearRegression()
lr.fit(X, y)

ridge = Ridge()
ridge.fit(X,y)

_, ax = plt.subplots(1,1)
ax.plot(range(len(lr.coef_)), lr.coef_)
ax.plot(range(len(ridge.coef_)), ridge.coef_)

plt.show()

ridge_cv = RidgeCV(alphas=[0.05, 0.08 ,0.1, 0.2, 0.8])
ridge_cv.fit(X, y)
print(ridge_cv.alpha_)
0.05
2.3 LASSO正则化
通过加入惩罚系数,消除系数之间的相关性。
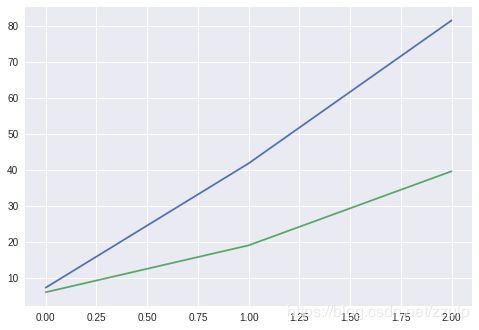
如下示例所示,使用线性回归得到系数全部是相关的,但使用lasso处理后,只有5个是相关的。
为了找到lasso正则化合适的参数,我们需要使用交叉验证来寻找最优的参数。
from sklearn.linear_model import Lasso, LinearRegression
from sklearn.datasets import make_regression

X, y = make_regression(n_samples=1000, n_features=500, n_informative=5, noise=10)

lr = LinearRegression()
lr.fit(X, y)
print(np.sum(lr.coef_ !=0))

lasso = Lasso()
lasso.fit(X, y)
print(np.sum(lasso.coef_ !=0))

from sklearn.linear_model import LassoCV
lasso_cv = LassoCV()
lasso_cv.fit(X, y)
print(lasso_cv.alpha_)
500
6
0.7173410510859349
2.6 LARS正则化
LARS是一种回归手段,用于解决高维问题,即特征数远大于样本数量。LARS好处是可以设定一个较小的特征数量,防止数据的过拟合。LarsCV也可用来探索最优的参数。
from sklearn.datasets import make_regression
from sklearn.linear_model import Lars

X, y = make_regression(n_samples=200, n_features=500, n_informative=10, noise=2)
lars = Lars(n_nonzero_coefs=10)

lars.fit(X, y)

print(np.sum(lars.coef_ != 0 ))
10
2.7 逻辑回归
逻辑回归和上面的线性回归使用方法类似。
from sklearn.linear_model import LogisticRegression
from sklearn import datasets

iris = datasets.load_iris()
lr = LogisticRegression()

lr.fit(iris.data[:100], iris.target[:100])

pred = lr.predict(iris.data[100:])

diff = pred - iris.target[100:]

print(diff)
[-1 -1 -1 -1 -1 -1 -1 -1 -1 -1 -1 -1 -1 -1 -1 -1 -1 -1 -1 -1 -1 -1 -1 -1
 -1 -1 -1 -1 -1 -1 -1 -1 -1 -1 -1 -1 -1 -1 -1 -1 -1 -1 -1 -1 -1 -1 -1 -1
 -1 -1]
2.8 Bayes岭回归
from sklearn import datasets
from sklearn.linear_model import BayesianRidge
import matplotlib.pyplot as plt

boston = datasets.load_boston()
beyes = BayesianRidge()
beyes.fit(boston.data, boston.target)
print(beyes.coef_)

bayes = BayesianRidge(alpha_1=10, lambda_1=10)
beyes.fit(boston.data, boston.target)
print(beyes.coef_)
[-0.10035603  0.04970825 -0.04362901  1.89550379 -2.14222918  3.66953449
 -0.01058388 -1.24482568  0.27964471 -0.01405975 -0.79764042  0.01011661
 -0.56264033]
[-0.10035603  0.04970825 -0.04362901  1.89550379 -2.14222918  3.66953449
 -0.01058388 -1.24482568  0.27964471 -0.01405975 -0.79764042  0.01011661
 -0.56264033]
2.9 GBR回归
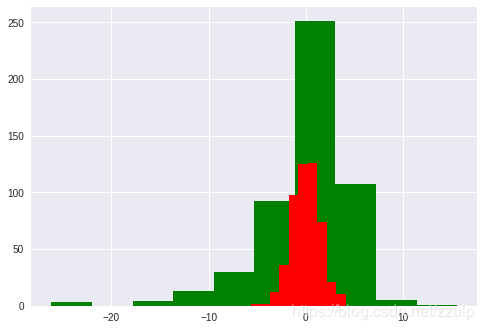
梯度提升树(GradientBoosting)是一种集成学习方法。在ensemble模块中提供了BGR供使用,下面的代码示例了GBR的使用方法,并与Linear模型的误差进行对比。
from sklearn import datasets
from sklearn.ensemble import GradientBoostingRegressor as GBR
from sklearn.linear_model import LinearRegression
import matplotlib.pyplot as plt

boston = datasets.load_boston()

lr = LinearRegression()
lr.fit(boston.data, boston.target)

pred = lr.predict(boston.data)
diff = pred - boston.target
plt.hist(diff, color='g')

gbr = GBR(n_estimators=100, max_depth=3, loss='ls')
gbr.fit(boston.data, boston.target)

pred = gbr.predict(boston.data)
diff = pred - boston.target
plt.hist(diff, color='r')
(array([  2.,   2.,  12.,  36.,  98., 125., 126.,  74.,  21.,  10.]),
 array([-5.64276266, -4.66928597, -3.69580928, -2.72233259, -1.7488559 ,
        -0.77537921,  0.19809748,  1.17157417,  2.14505086,  3.11852755,
         4.09200424]),
 )
3 聚类模型
3.1 使用KMeans进行聚类
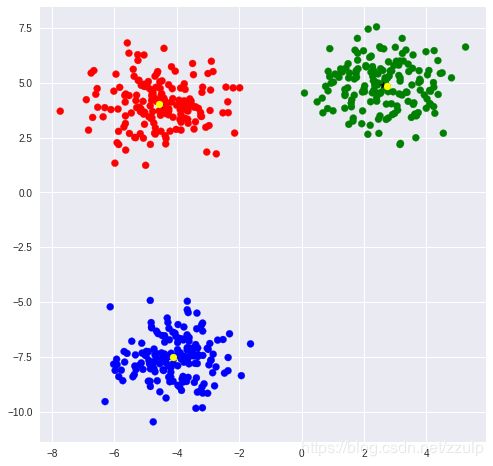
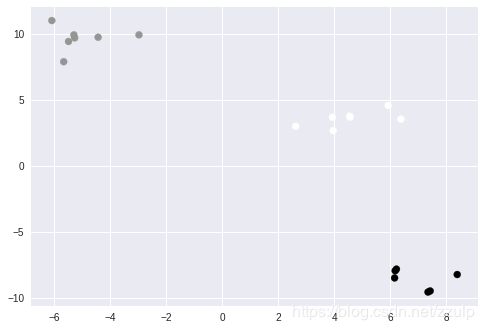
KMeans是最为常用的聚类方式,在cluster模块中可以找到KMeans类。通过指定中心数量可以令模型进行无监督聚类。
KMeans实例对象属性labels_保存了所有点的聚类标签,可以通过标签观察同一类的点。
当数据量很大时,KMeans计算很慢,这时可以使用Mini Batch KMeans来加速计算。
from sklearn.datasets import make_blobs
import matplotlib.pyplot as plt
import numpy as np
from sklearn.cluster import KMeans, MiniBatchKMeans

rgb=np.array(['r', 'g', 'b'])
blobs, classes = make_blobs(500, centers=3)
_, ax = plt.subplots(figsize=(8,8))
ax.scatter(blobs[:,0], blobs[:, 1], color=rgb[classes])

kmean = KMeans(n_clusters=3)
kmean.fit(blobs)
print(kmean.cluster_centers_)
#for kind in range(len(classes)):
#    print(blobs[kmean.labels_== kind])
ax.scatter(kmean.cluster_centers_[:,0], kmean.cluster_centers_[:,1], marker='*', color='black')


mb_kmean = MiniBatchKMeans(n_clusters=3, batch_size=100)
mb_kmean.fit(blobs, classes)
print(mb_kmean.cluster_centers_)
ax.scatter(mb_kmean.cluster_centers_[:,0], mb_kmean.cluster_centers_[:,1], marker='o', color='yellow')
[[ 2.62505603  4.87281732]
 [-4.10154624 -7.5409836 ]
 [-4.5489481   4.00556156]]
[[ 2.72677398  4.8618203 ]
 [-4.10933407 -7.50669163]
 [-4.56130824  4.04383432]]
3.2 优化聚类的数量
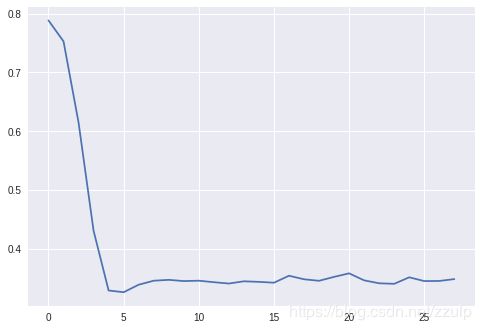
使用Silhouette距离的均值来衡量聚类结果的好坏,在metrics模块中可以找到silhouette_score方法来计算得分。
通过计算一系列的不同的聚类数量的得分,通常得分最高的位置附近是比较好的聚类数量取值。
from sklearn import metrics
from sklearn.datasets import make_blobs
import matplotlib.pyplot as plt
from sklearn.cluster import KMeans

blobs, classes = make_blobs(500, centers=3)

scores = []

for k in range(2, 30):
    kmean = KMeans(n_clusters=k)
    kmean.fit(blobs, classes)

    scores.append(metrics.silhouette_score(blobs, kmean.labels_))

print(scores)
plt.plot(range(len(scores)), scores)
[0.7886309932105221, 0.7529271814274128, 0.6146973574146535, 0.4302651403684647, 0.3285318660943046, 0.32560763252948505, 0.33836744321304496, 0.3452056475433186, 0.3466567774597919, 0.344592536284487, 0.34523240219690204, 0.34265770815544033, 0.3403885093830953, 0.3442014721691386, 0.34323575309881027, 0.3418006941853705, 0.35367134774799686, 0.34764025436969426, 0.34505365612553296, 0.3517117523350353, 0.3577407169626914, 0.3458147106597954, 0.34080496590913045, 0.33990321947115615, 0.35098916233043775, 0.344594071344537, 0.34477844590350915, 0.34794461122938564]


[]
3.3 寻找特征空间中最接近的对象
给定一些点,我们希望以一定的方式计算其与其他点的距离,sklearn的pairwise模块提供了这种便利。
pairwise_distances可以以指定的方式计算两两之间的距离,目前支持的距离方式有:hamming, cosine, euclidean, manhattan, l1,l2,ciyblock等。
from sklearn.metrics import pairwise
import matplotlib.pyplot as plt
from sklearn.datasets import make_blobs

points, labels = make_blobs(n_samples=20, centers=3)
plt.scatter(points[:, 0], points[:, 1], c=labels)

dist = pairwise.pairwise_distances(points, metric='euclidean')

print(dist.shape)
print(dist[0])
(20, 20)
[ 0.         22.89308807  2.56555945 13.24114319 11.02938882 20.82368041
 11.51752616 22.43691943 22.86857453 21.34544019 11.56896063  1.69132639
 20.90143498 12.3970374  11.6082638   0.34855675 10.33852078  1.10400601
  1.53791614  0.53539892]
3.4 使用KMeans进行离群点检测
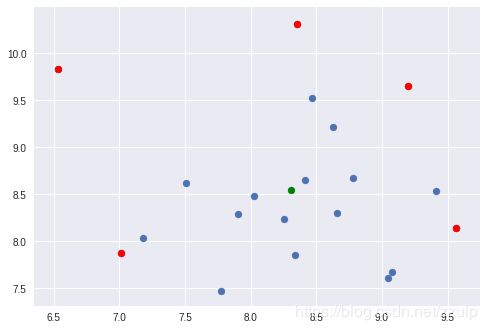
有时候我们需要假设离群点是异常数据,此时就需要识别出它们并从数据集中移除。检测离群点的操作是查找簇的质心,之后通过点到质心的距离来识别潜在的离群点。
距离的计算可以使用上节的pairwise方式,但KMeans对象的transform方法帮我们实现了这个到中心点距离的计算,省去我们自己去实现。
from sklearn.metrics import pairwise
from sklearn.datasets import make_blobs
from sklearn.cluster import KMeans
import matplotlib.pyplot as plt
import numpy as np

points, labels = make_blobs(n_samples=20, centers=1)
print(points.shape)
plt.scatter(points[:, 0], points[:, 1])

kmean = KMeans(n_clusters=1)
kmean.fit(points)
plt.scatter(kmean.cluster_centers_[:,0], kmean.cluster_centers_[:, 1], color='green')

all = np.vstack([kmean.cluster_centers_, points])
dist1 = pairwise.pairwise_distances(all)

dist2 = kmean.transform(points)

print(np.argsort(dist1[0])[1:] - 1)

sort_idx = np.argsort(dist2.ravel())
print(sort_idx)


out_p = points[sort_idx][-5:]
plt.scatter(out_p[:,0], out_p[:, 1], color='red')
(20, 2)
[ 3 17  1  5 19  2 14  8 11 10  0  4 16 18 12  7 13 15  9  6]
[ 3 17  1  5 19  2 14  8 11 10  0  4 16 18 12  7 13 15  9  6]
3.9 使用KNN进行回归
KNN是属于监督学习的方法,它使用特征空间中邻近的K个点来构建回归,不像常规回归那样使用整个特征空间。
其原理非常简单,找到被测点的最临近的K的点,计算其均值。
from sklearn import datasets
from sklearn.neighbors import KNeighborsRegressor
from sklearn.metrics import mean_squared_error, r2_score
import matplotlib.pyplot as plt


boston = datasets.load_boston()
knn = KNeighborsRegressor(n_neighbors=10)

train_num = 150
knn.fit(boston.data[:train_num], boston.target[:train_num])

pred = knn.predict(boston.data[train_num:])

print(mean_squared_error(boston.target[train_num:], pred))
print(r2_score(boston.target[train_num:], pred))
90.88220533707864
0.14269935079131102
4 分类模型
4.1 使用决策树分类
决策树根据一些条件进行分支条件的判断。sklearn的tree模块提供了决策树的实现。在构建决策树时,可以指定树的分叉标准和树的最大深度。
from sklearn.tree import DecisionTreeClassifier
from sklearn import datasets

iris = datasets.load_iris()
clf = DecisionTreeClassifier(criterion='entropy',max_depth=2)

sel = np.random.choice([True, False], len(iris.data), p=[0.75, 0.25])

clf.fit(iris.data[sel], iris.target[sel])

pred = clf.predict(iris.data[~sel])

print((pred == iris.target[~sel]).mean())
0.972972972972973
4.2 使用随机森林进行分类
随机森林对于过拟合非常健壮,它通过构造大量浅层树,让每查树为分类投票,再选择投票结果。因此随机森林也是一种集成算法。
from sklearn.ensemble import RandomForestClassifier
from sklearn import datasets

iris = datasets.load_iris()
clf = RandomForestClassifier(n_estimators=10, max_depth=2)

sel = np.random.choice([True, False], len(iris.data), p=[0.75, 0.25])

clf.fit(iris.data[sel], iris.target[sel])

pred = clf.predict(iris.data[~sel])

print((pred == iris.target[~sel]).mean())
0.975
4.3 使用SVM对数据进行分类
SVM背后的原理是寻找一个平面,将数据分割为组。
from sklearn.svm import SVC, LinearSVC
from sklearn import datasets

iris = datasets.load_iris()
clf = SVC(kernel='rbf', gamma=0.1)

sel = np.random.choice([True, False], len(iris.data), p=[0.75, 0.25])

clf.fit(iris.data[sel], iris.target[sel])

pred = clf.predict(iris.data[~sel])

print((pred == iris.target[~sel]).mean())

clf = LinearSVC()
clf.fit(iris.data[sel], iris.target[sel])

pred = clf.predict(iris.data[~sel])

print((pred == iris.target[~sel]).mean())
1.0
0.9142857142857143
4.4 使用多分类来归纳
在处理线性模型时,需要使用OneVsRestClassifier,这个模式会为每个类创建一个分类器。每个分类器只预测一种类型,在所有分类器的输出中,输出概率最大的分类器对应了相应的类别。
from sklearn.linear_model import LogisticRegression
from sklearn import datasets
from sklearn.multiclass import OneVsRestClassifier

iris = datasets.load_iris()
clf = OneVsRestClassifier(LogisticRegression(), n_jobs=2)

sel = np.random.choice([True, False], len(iris.data), p=[0.75, 0.25])

clf.fit(iris.data[sel], iris.target[sel])

pred = clf.predict(iris.data[~sel])

print((pred == iris.target[~sel]).mean())
0.975609756097561
4.5 使用LDA进行分类
LDA指的是线性判别分析,当数据每个类的协方差类似是可以使用。
from sklearn.discriminant_analysis import LinearDiscriminantAnalysis,  QuadraticDiscriminantAnalysis
from sklearn.metrics import classification_report
from sklearn import datasets

iris = datasets.load_iris()

lda = LinearDiscriminantAnalysis()
lda.fit(iris.data, iris.target)
pred = lda.predict(iris.data)
print(classification_report(iris.target, pred))

qda =  QuadraticDiscriminantAnalysis()
qda.fit(iris.data, iris.target)
pred = qda.predict(iris.data)
print(classification_report(iris.target, pred))
             precision    recall  f1-score   support

          0       1.00      1.00      1.00        50
          1       0.98      0.96      0.97        50
          2       0.96      0.98      0.97        50

avg / total       0.98      0.98      0.98       150

             precision    recall  f1-score   support

          0       1.00      1.00      1.00        50
          1       0.98      0.96      0.97        50
          2       0.96      0.98      0.97        50

avg / total       0.98      0.98      0.98       150
4.6 使用SGD进行分类
from sklearn import linear_model
from sklearn import datasets
from sklearn.metrics import classification_report


iris = datasets.load_iris()

sgd = linear_model.SGDClassifier()
sgd.fit(iris.data, iris.target)

pred = sgd.predict(iris.data)

print(classification_report(iris.target, pred))
             precision    recall  f1-score   support

          0       0.83      1.00      0.91        50
          1       0.71      0.80      0.75        50
          2       1.00      0.68      0.81        50

avg / total       0.85      0.83      0.82       150


/usr/local/lib/python3.6/dist-packages/sklearn/linear_model/stochastic_gradient.py:128: FutureWarning: max_iter and tol parameters have been added in  in 0.19. If both are left unset, they default to max_iter=5 and tol=None. If tol is not None, max_iter defaults to max_iter=1000. From 0.21, default max_iter will be 1000, and default tol will be 1e-3.
  "and default tol will be 1e-3." % type(self), FutureWarning)
4.7 使用朴素Bayes进行文本分类
下面的示例使用Bayes做一个简单的文本分类计算,语料使用自带的newsgroups,从中选择两个类别。
特征提取方面,使用了sklearn的词频计数作为特征,并且对比TF-IDF的特征化对分类算法的影响。
from sklearn.naive_bayes import GaussianNB
from sklearn.datasets import fetch_20newsgroups
from sklearn.metrics import classification_report
from sklearn.feature_extraction.text import CountVectorizer, TfidfVectorizer
from sklearn.cluster import KMeans
import numpy as np


categories = ['rec.autos',  'talk.politics.guns', 'rec.motorcycles',]
newsgroups = fetch_20newsgroups(categories=categories)

# print('\n'.join(newsgroups.data[0:2]))
# print(newsgroups.target[0:2])
print(len(newsgroups.data)) # 1738

def train(vector, target):
    train_num = 1700
    bayes = GaussianNB()

    bayes.fit(vector[:train_num], target[:train_num])
    pred = bayes.predict(vector[train_num:])

    print(classification_report(target[train_num:], pred))
    return bayes

cv = CountVectorizer()
vector = cv.fit_transform(newsgroups.data).todense()
# print(vector[0])
print('train clf with CountVectorizer')
train(vector, newsgroups.target)

cv2 = TfidfVectorizer()
vector2 = cv2.fit_transform(newsgroups.data).todense()
print('train clf with TfidfVectorizer')
bayes = train(vector2, newsgroups.target)

print(newsgroups.data[-1])
print(vector2[-1])

print(bayes.predict(vector2[-1]))
print(newsgroups.target[-1])

kmean =  KMeans(n_clusters=3)
kmean.fit(vector2)

ratio = np.sum(kmean.labels_==newsgroups.target) / len(newsgroups.target)
print(ratio)
1738
train clf with CountVectorizer
             precision    recall  f1-score   support

          0       0.93      1.00      0.96        13
          1       1.00      0.86      0.92         7
          2       1.00      1.00      1.00        18

avg / total       0.98      0.97      0.97        38

train clf with TfidfVectorizer
             precision    recall  f1-score   support

          0       0.93      1.00      0.96        13
          1       1.00      0.86      0.92         7
          2       1.00      1.00      1.00        18

avg / total       0.98      0.97      0.97        38

Subject: thanks to poster of NY Times article on ATF in Texas
From: [email protected] (John Kim)
Distribution: world
Organization: Harvard University Science Center
Nntp-Posting-Host: scws8.harvard.edu
Lines: 12


good job to whoever posted the article.  I'd
been saving that NYTimes edition for a while, planning to ytpe it
in myself, but now I don't have to.

For all of those people who were worried about whether or not
the media would even question the raid, we owe it to the
NY Times (despite their rabidly anti-gun editorials) for
being willing to talk to these 4 BATF  agents.

-Case Kim


[[0. 0. 0. ... 0. 0. 0.]]
[2]
2
0.3003452243958573
4.8 标签传递半监督学习
如果我们有一个数据集,其中只标注了一部分,还有一些没有标注,此时可以尝试标签传递/扩展算法来进行训练。
下面的代码在iris数据集上人为的设置一些数据为未标注,并使用标签传递来进行训练,最后看预测结果和原始标注的对比。
from sklearn import datasets
import numpy as np
from sklearn import semi_supervised
from sklearn.metrics import classification_report


iris = datasets.load_iris()

X = iris.data.copy()
y = iris.target.copy()

names = iris.target_names.copy()
names = np.append(names, ['unlabeled'])

unlabel = np.random.choice([True, False], len(y))
y[unlabel] = -1
print(y[:10])

train = unlabel = np.random.choice([True, False], len(y), p=[0.8,0.2])

def run(clf, X, y, train, target):

    clf.fit(X[train], y[train])
    pred = lp.predict(X[~train])
    print(classification_report(pred, target[~train]))

lp = semi_supervised.LabelPropagation()
ls = semi_supervised.LabelSpreading()

run(lp, X, y, train, iris.target)
run(ls, X, y, train, iris.target)
[-1 -1 -1 -1  0  0 -1  0 -1  0]
             precision    recall  f1-score   support

          0       1.00      1.00      1.00        11
          1       0.82      0.90      0.86        10
          2       0.92      0.85      0.88        13

avg / total       0.91      0.91      0.91        34

             precision    recall  f1-score   support

          0       1.00      1.00      1.00        11
          1       0.82      0.90      0.86        10
          2       0.92      0.85      0.88        13

avg / total       0.91      0.91      0.91        34


/usr/local/lib/python3.6/dist-packages/scipy/sparse/csgraph/_laplacian.py:72: FutureWarning: Conversion of the second argument of issubdtype from `int` to `np.signedinteger` is deprecated. In future, it will be treated as `np.int64 == np.dtype(int).type`.
  if normed and (np.issubdtype(csgraph.dtype, int)
5 模型后处理
5.1 K-Fold交叉验证
K-Fold可将数据集划分为K份,并依次取其中一份作为测试集,其他数据作为训练集,直到每一份都作为测试集被测试过。
sklearn中的KFold实例返回一个生成器,生成器每次返回一批训练集和测试集的索引。
from sklearn.model_selection import KFold

X = np.arange(12).reshape(6,2)
y = np.array([1,1,1,0,0,0])

kfold = KFold(n_splits=3)
for train_index, test_index in kfold.split(X):
    print(train_index, test_index)
#     X_train, X_test = X[train_index], X[test_index]
#     y_train, y_test = y[train_index], y[test_index]
[2 3 4 5] [0 1]
[0 1 4 5] [2 3]
[0 1 2 3] [4 5]
5.2 自动化交叉验证
上节的过程可以被一个函数进行自动化执行。
from sklearn import ensemble
from sklearn import datasets
from sklearn import model_selection


boston = datasets.load_boston()
clf = ensemble.RandomForestRegressor(max_features='auto')

scores = model_selection.cross_val_score(clf, boston.data, boston.target)
print(scores)
[0.80401839 0.55784815 0.25571493]
5.3 使用ShuffleSplit交叉验证
shufflesplit是另一个交叉验证的技巧。它可以将数据集打散,并随机选择指定的元素作为测试集,其他元素作为训练集。和KFold类似,它返回的生成器会生成多个交叉的集合索引。
from sklearn.model_selection import ShuffleSplit

X = np.arange(12).reshape(6,2)
y = np.array([1,1,1,0,0,0])

sp = ShuffleSplit(n_splits=4, train_size=4, test_size=2)

for train, test in sp.split(X):
    print(train, test)
[4 3 5 0] [2 1]
[3 2 4 0] [5 1]
[1 3 0 4] [2 5]
[3 5 4 1] [2 0]
5.4 分层的KFold
有时,数据集不同类的数据存在一定的比例,为了在kfold时仍维持这个比例,就需要使用StratifiedKFold用于生成同样比例的训练集和测试集。
下面代码中,数据集中正例与反例的比例是2:1,经过分层KFold后的数据集也满足2:1。
from sklearn.model_selection import StratifiedKFold

X = np.arange(12).reshape(6,2)
y = np.array([1,1,1,1,0,0])

kfold = StratifiedKFold(n_splits=2)
for train, test in kfold.split(X, y):
    print(train, test)
[2 3 5] [0 1 4]
[0 1 4] [2 3 5]
5.5 网格搜索
网格搜索主要为了解决参数的自动搜索问题。例如对于决策树,需要优化的参数包括树的分裂方法,最大层数等。我们可以自己编写代码组合不同的参数来训练模型,并从中选择最好的参数和模型,sklearn已经内建网络搜索的方法。
from sklearn import datasets
from sklearn.linear_model import LogisticRegression
from sklearn import grid_search


boston = datasets.load_iris()
lr = LogisticRegression()
lr.fit(boston.data, boston.target)

search_params = {
    'penalty': ['l1', 'l2'],
    'C': [1, 2, 3, 4]
}

gs = grid_search.GridSearchCV(lr, search_params)
gs.fit(boston.data, boston.target)

print(gs.grid_scores_)
print(max(gs.grid_scores_, key=lambda x: x[1]))
[mean: 0.94000, std: 0.03207, params: {'C': 1, 'penalty': 'l1'}, mean: 0.94667, std: 0.01794, params: {'C': 1, 'penalty': 'l2'}, mean: 0.96000, std: 0.04217, params: {'C': 2, 'penalty': 'l1'}, mean: 0.95333, std: 0.02426, params: {'C': 2, 'penalty': 'l2'}, mean: 0.96000, std: 0.04217, params: {'C': 3, 'penalty': 'l1'}, mean: 0.95333, std: 0.02426, params: {'C': 3, 'penalty': 'l2'}, mean: 0.96000, std: 0.04217, params: {'C': 4, 'penalty': 'l1'}, mean: 0.96000, std: 0.02745, params: {'C': 4, 'penalty': 'l2'}]
mean: 0.96000, std: 0.04217, params: {'C': 2, 'penalty': 'l1'}
5.7 伪造评估器来比较结果
主要使用dummy模块提供的dummyRegressor和DummyClassifier类来返回一些指定策略的回归或分类值。
5.8 回归模型评估
在metrics模块中提供了各种的评估函数,针对分类,回归,聚类都有不同的评估方式。
| 度量函数 | 说明 |
|---|---|
| metrics.mean_squared_error | MSE误差 |
| mean_squared_log_error | MSLE误差 |
| r2_score | 决策系数回归得分 |
5.9 特征选取
from sklearn import feature_selection
from sklearn import datasets
import matplotlib.pyplot as plt

boston = datasets.load_boston()

f, p = feature_selection.f_regression(boston.data, boston.target)
print(f)
print(p)

plt.bar(range(len(p)), p)
[ 88.15124178  75.2576423  153.95488314  15.97151242 112.59148028
 471.84673988  83.47745922  33.57957033  85.91427767 141.76135658
 175.10554288  63.05422911 601.61787111]
[2.08355011e-19 5.71358415e-17 4.90025998e-31 7.39062317e-05
 7.06504159e-24 2.48722887e-74 1.56998221e-18 1.20661173e-08
 5.46593257e-19 5.63773363e-29 1.60950948e-34 1.31811273e-14
 5.08110339e-88]
5.10 L1范数上的特征选择
from sklearn import feature_selection
from sklearn import datasets
from sklearn import linear_model
from sklearn import metrics
from sklearn.cross_validation import ShuffleSplit

import numpy as np
import matplotlib.pyplot as plt

boston = datasets.load_boston()

sp = ShuffleSplit(len(boston.data), 4)


train, test = next(iter(sp))
#print(train, test)


lr = linear_model.LinearRegression()
lr.fit(boston.data[train], boston.target[train])
pred = lr.predict(boston.data[test])

mse = metrics.mean_squared_error(boston.target[test], pred)
print(mse)

la = linear_model.LassoCV()
la.fit(boston.data, boston.target)
print(la.coef_)
columns = np.arange(boston.data.shape[1])[la.coef_>0]
print(columns)

X = boston.data[:, columns]
lr.fit(X[train], boston.target[train])
pred = lr.predict(X[test])

mse = metrics.mean_squared_error(boston.target[test], pred)
print(mse)
23.782395846128534
[-0.07391859  0.04944576 -0.          0.         -0.          1.80092396
  0.01135702 -0.81333654  0.27206588 -0.01542027 -0.74314538  0.00898036
 -0.70409988]
[ 1  5  6  8 11]
41.908110910553106
5.11 使用joblib保存模型
from sklearn.externals import joblib

joblib.dump(lr, 'model.clf')

m = joblib.load('model.clf')
