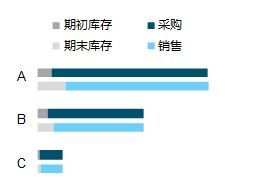
Excel中图表如下:
今天折腾了大半天,在ggplot2中,要不是堆积图要么就是非堆积的,没法像Excel中做到分组堆积(也许有办法,但我目前还不知道该如何实现-_-!)
只能是在R中做了个类似的,但问题很多。。。
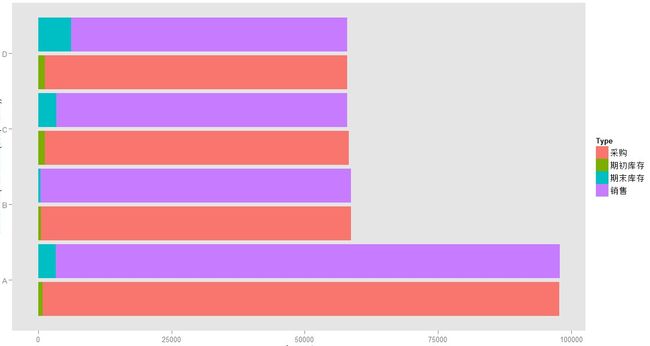
R中图形如下:
因为是模拟出来的,还没法对A,B,C,D进行调整间隔,如果不看对应的Y轴标签无法很清淅的从图表上看出谁和谁是一组的
R中代码如下:
channel <- read.xlsx("c:/myR/channel.xlsx",sheetName="Sheet2",encoding="UTF-8")


ggplot(channel, aes(x = as.numeric(interaction(Left,Name)), y = Amount, fill =Type,group=Name)) #把x轴的显示的内容处理下分组序号
 +   geom_bar(stat = "identity")
 +  scale_x_continuous(breaks=c(1.5,3.5,5.5,7.5),labels=c("A","B","C","D"))#主要靠这里来定制X轴的显示内容,
+theme( panel.grid.major=element_blank(),panel.grid.minor=element_blank())
+coord_flip() #翻转如果不加这句则图像为柱状图
数据如下:
| Name | Type | Amount | Left |
| A | 期初库存 | 842 | L |
| A | 采购 | 96,907 | L |
| A | 期末库存 | 3,250 | R |
| A | 销售 | 94,541 | R |
| B | 期初库存 | 493 | L |
| B | 采购 | 58,210 | L |
| B | 期末库存 | 381 | R |
| B | 销售 | 58,321 | R |
| C | 期初库存 | 1,215 | L |
| C | 采购 | 56,999 | L |
| C | 期末库存 | 3,373 | R |
| C | 销售 | 54,540 | R |
| D | 期初库存 | 1,293 | L |
| D | 采购 | 56,699 | L |
| D | 期末库存 | 6,206 | R |
| D | 销售 | 51,785 | R |
结果并不如意,或许还有好办法,再研究研究。。。。
---------------------------------------------------------------------------------------------------------------------------------------------
update 2015-07-16
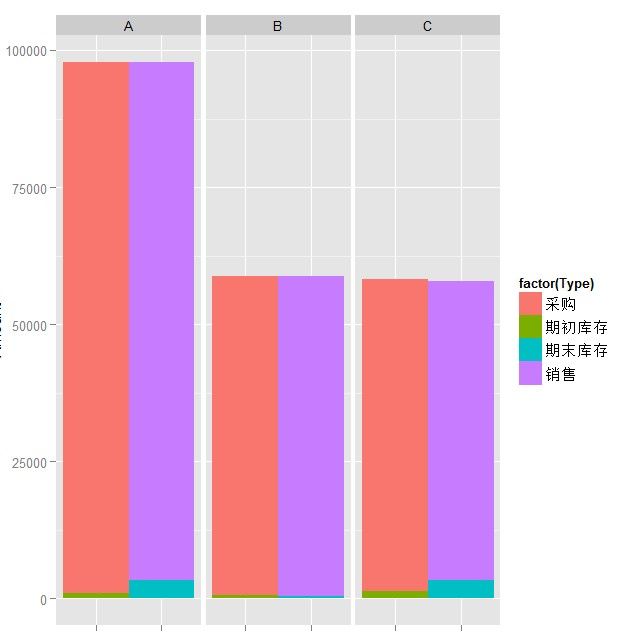
有了另一种解决方案,比上面的效果要好,但只能是柱状的,不知道怎么样才能设成条状的。不过至少图形看起来能达到分组堆积的效果了
代码:
ggplot(data = channel2, aes(x = Left, y = Amount, fill = factor(Type) ,order = as.numeric(factor(channel2$Type,levels=c("期初库存","采购","期末库存","销售")))   ))
 + geom_bar(stat = "identity", width = 1, position = "stack" )
+ facet_grid(. ~ Name,scales = "free_x")
+ theme(axis.text.x =element_blank())

#数据还是最上面的数据,对数据按Name进行分片,然后x轴绑定Left字段,再在最后将X轴上显示的文字取消.
#order = as.numeric(factor(channel2$Type,levels=c("期初库存","采购","期末库存","销售")))    是设置堆积图的顺序
------------------------------------------------------------------------------------------------------
update
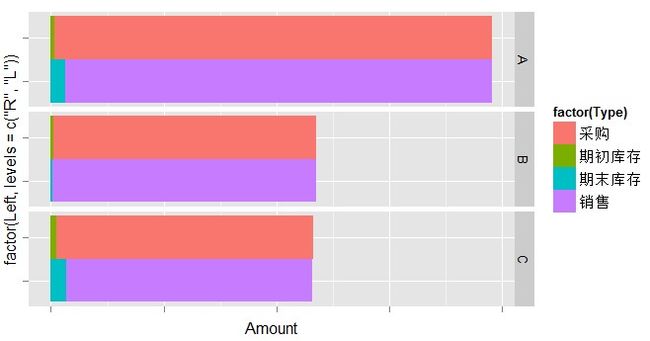
嗯嗯,这次效果终于更进一步,
代码
ggplot(data = channel2, aes(x =factor(Left,levels=c("R","L")), y = Amount, fill = factor(Type) ,order = as.numeric(factor(channel2$Type,levels=c("期初库存","采购","期末库存","销售")))   ))
+ geom_bar(stat = "identity", width = 1, position = "stack" )
+ theme(axis.text.x =element_blank(),axis.text.y =element_blank()) #不显示Y,X轴的标签
+coord_flip() #翻转
+facet_grid(Name~.) #分片(fact_grid(Name~.) 分片按行显示如上图,(facet_grid(.~Name) 分片按列显示,如上上图 ^^)


